Showing posts with label data art. Show all posts

Tuesday, January 20, 2015

Political Instability at a Glance

(A graph-heavy post on the post-WWII history of political instability.)

(Update 1/24/2014: Thanks to Profs. Gleditsch, Goemans, and Chiozza for allowing me to use the beta version of Archigos, updated with leader information to the end of 2014)

Despite its ubiquity in everyday discourse, I find the concept of "political instability" exasperatingly vague, encompassing everything from polarized electorates to coups to civil war. Nevertheless, one can still understand most of the phenomena that fall under that rubric as the sorts of events that happen when the norms supposedly regulating political competition fail to be "recognized" as relevant or worth following by sufficiently powerful groups of people. Very wide-ranging normative breakdowns are revolutions and civil wars (Jack Goldstone once noted that the great revolutions were characterized by "fractal" breakdowns of norms regulating conduct at all levels); but coups, other forms of "irregular" leader exit, spikes of protest, and transitional situations can be understood as moments where the norms that are supposed to channel and limit the competition for power break down, either because sufficiently powerful groups disagree about what the relevant norms are, or because they want to change them, or because they can disregard them with impunity.

The identification of political instability events is unavoidably fraught, since what counts as the relevant norm governing political competition, and whether the norm has actually been violated, disregarded, or otherwise violently reinterpreted, will often be disputed. Sometimes it will simply be impossible to tell whether some particular event -- e.g, the recent happenings in Lesotho or the Gambia -- counts as a coup, or whether the fall of some leader is in accordance with "recognized" norms of political competition; indeed, I take it that sometimes there is simply no fact of the matter, though perhaps the very existence of disagreement about the nature of the event is itself significant as an indicator of instability. And of course many events that signal the weakness of norms regulating political competition -- aborted coup attempts, thwarted palace conspiracies -- simply never see the light of day. Nevertheless, it is still possible to get a glimpse of the broad patterns of political instability during the post WWII era.

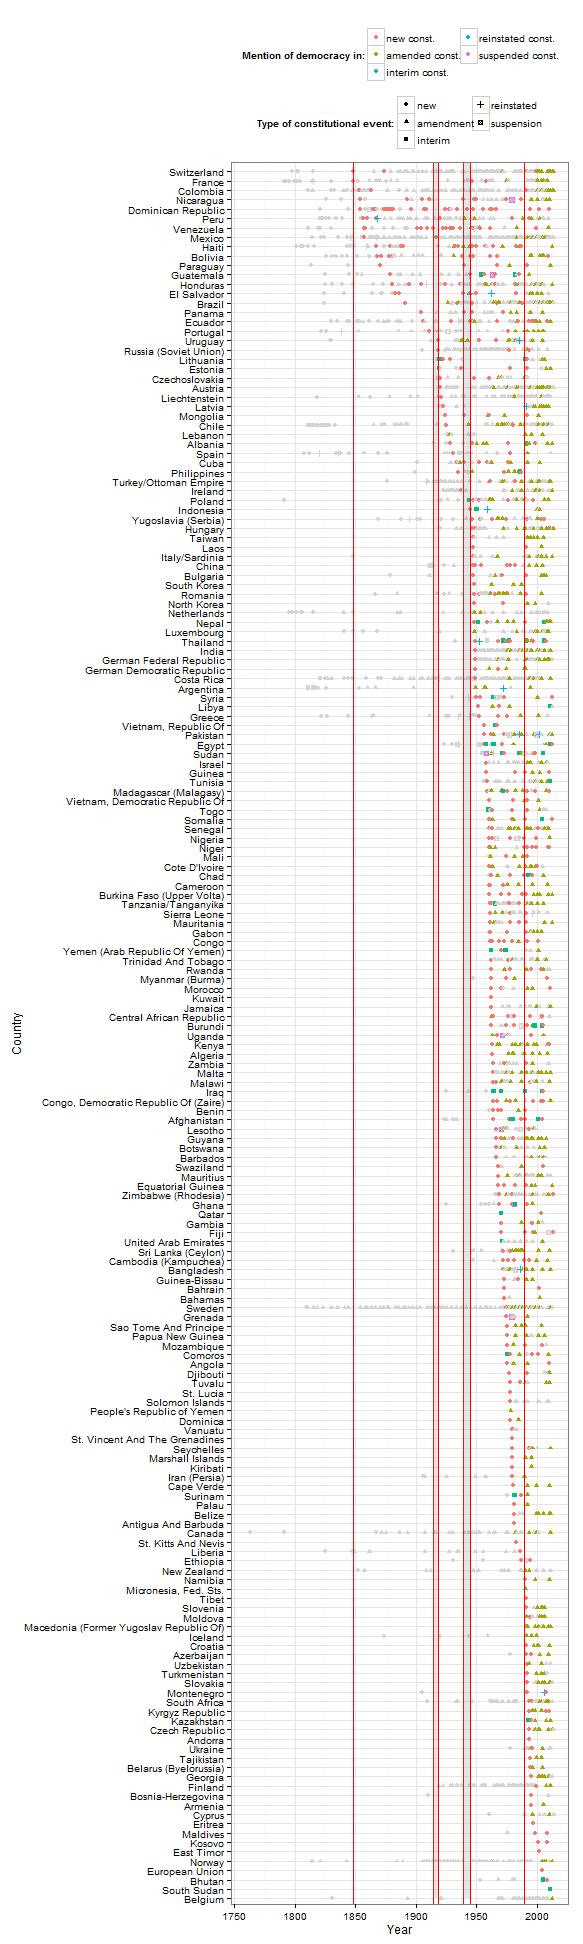
Here's one way of doing it, which produces lovely "spectral lines" of macropolitical instability. The picture below graphs five forms of instability, per country: the estimated level of democracy and thus regime change, for the period 1946-2012 (from the Unified Democracy Scores by Pemstein, Meserve, and Melton); successful and unsuccessful overt coup attempts for the period 1950-2014 (vertical red and blue lines, respectively, from the data gathered by Powell and Thyne, supplemented before 1950 with data for successful and attempted coups from Marshall and Marshall); irregular leader exits (dotted black lines, sometimes coinciding, sometimes not, with the coup data from Powell and Thyne, and including everything from assassinations to revolutionary overthrow that occurs outside whatever prima facie normative framework of political competition holds in the particular country), from the period 1946-2014 (from the beta version of the Archigosdataset by Goemans, Gleditsch, and Chiozza - thanks for prof. Gleditsch for sharing a copy!); shaded colored areas track armed conflict episodes from 1946 to 2013 (from the UCDP/PRIO dataset); and periods of "interruption," "interregnum," or "transition" (light grey shaded areas; basically, foreign occupation, anarchy, political breakdown or explicitly transitional governments) from the polity dataset, in the 1946 to 2013 period. The figure is arranged regionally, by continent: African countries first, then American countries, then Asian, and so on, so that countries in geographical proximity to one another appear close together in the picture:
Coups, wars, irregular leadership transitions, changes in democracy, and periods of "interruption" are distinct phenomena, but they all indicate historical moments where the norms regulating "macropolitical" competition are fluid: where powerful parties don't agree about the definition of the state, the procedures for transferring power, etc. The graph is deliberately crowded -- it is meant to produce an overall glimpse of the "spectrum" of instability in the postwar history of each country, not a detailed history of each country -- yet some events are easily identifiable: major interstate wars (in green: the Korean War, the Vietnam war, the Ethiopia-Eritrea conflict, the Yugoslav wars); colonial liberation struggles (in red, such as the struggle for independence in Zimbabwe); the interminable series of conflicts of the Burmese state against its outlying "Zomian" minorities; the endless series of coups and countercoups in Argentina starting with Peron's first presidency in 1946; the coup against Allende in Chile in 1973; the disintegration of the Afghan state since the 80s; the transition to democracy in Spain; and so on. Each country has its own distinctive pattern of macropolitical instability, though in general wherever a country has experienced these sorts of events they have tended to "cluster" in time; macropolitical instability is rarely continuous over long stretches. Similar events also have a tendency to happen in similarly-situated countries, leading to distinct regional patterns:
At this level of aggregation we can see that South American countries have suffered more from coups than from armed conflict, yet coups and irregular leader exits have declined in frequency over the last three decades; that South and South-East Asian states (Myanmar, India, Vietnam, Laos, etc.) have suffered much more from armed conflict of all kinds than from coups; how states in Western Africa and Eastern Asia (basically, the Middle East) have seen a simultaneous decline in coups and an increase in armed conflict of all kinds. (Distinct events with regional implications are also visible - e.g., the central American wars of the 1980s). It is worth noting that these patterns coexist with an increase in measured levels of democracy in most regions of the world since the middle of the 1980s. (The horizontal red line in each picture represents a score of zero in the UDS data, which can be interpreted as the dividing line between democracy and autocracy; by that criterion, in a majority of regions of the world a majority of countries are democratic today, though in some cases barely so).

I suspect that some of these patterns are basically attributable to the timing of consolidation of post-colonial states. For example, if we could extend these pictures back in time we would see many more internal and even some external conflicts in Latin America, as states were consolidated after independence from Spain; much of the internal conflict we see in places like India or Myanmar against groups on their borderlands can be understood as state-consolidation conflict - conflict over who is subject to state power, and to what degree. But as states consolidate, struggles over the definition of the state may give way to struggles over the norms of political competition (coups and irregular leader exits); and these in turn can eventually either lead either to "stability" (relative consensus on the norms of political competition, or at least the victory of one faction or person over the rest, as in long-term personal dictatorships, leading to a decline in in coups and other forms of irregular leader exit) or state disintegration (renewed internal conflict). Consider a picture at an even higher level of aggregation, by continent:
One interpretation of this figure might go like this: the anticolonial struggles of African countries give way by the 70s to a fluid period of coups and countercoups as various powerful groups struggled to define the norms of political competition for control of the new states, often with the intervention of major powers during the Cold War. Yet instead of leading to the eventual victory of some particular norm of political competition, coups and countercoups eventually escalated into renewed conflicts over the very definition of the state -- "internal" wars of various kinds -- since the post-colonial state was a pretty recent and fragile creation to begin with. By contrast, in the Americas, the tendency has been for norms of "democratic" political competition to become entrenched in the context of relatively consolidated states; while the military may still intervene in politics, they find it harder to do so in an overt way. Though there are many reasons for this (including, e.g., changes in the foreign policy of the US) one important factor seems to have been the lessening of radical ideological conflict, which means deviations from norms of democratic competition are more costly and have less point. In fact, the risk of military intervention in politics in Latin America appears to remain highest precisely where ideological conflict over the nature of the state is fiercest, as in Venezuela and Ecuador. The Asian pattern in turn is less about the consolidation of new states than about border adjustment after the colonial period and the bringing of borderlands under central state control, rather than about the consolidation of new states; while the European post-war pattern mostly involves the late transitions to democracy of Southern Europe and separatist conflicts of varying intensity - all legacies of the wars of the first half of the 20th century, which of course are not visualized here.

For completeness, here are the political instability spectral lines of the world:
This is not especially informative (though it does show the trend away from interstate to intrastate conflict, and the long-run transition to norms of democratic political competition around the world), but I find it strangely beautiful.

Instead of aggregating these pictures of political instability, we can disaggregate them and expand them into "geological" pictures of the historical strata of political change. Here's one way of using the enormous amount of information available in these datasets to auto-generate political histories, using the example of Argentina. For the picture immediately below, start at the top, at the end of 2014; as we scroll down (the image is in its natural element online, with its endless scrolling; but one can imagine also a slowly unrolling codex) we move deeper into the country's history. The first thing we encounter is the name of the serving president as of the end of 2014, Cristina Fernandez de Kirchner; the name is grayed out - "still in office as of 2014;" leaders who died in office, retired without serving their full term, or were removed by irregular means (e.g., by a coup) are in darker font, to make them stand out (the darker, the more irregular). Each leader's name is placed at the date of his or her exit from power (or 2014 if still in office by the time the Archigos dataset ends), so anything below Kirchner until the next name appears happened during the Kirchner government. If data are available, we see a thick black vertical line representing the Polity score for that year; the further to the right, the more "democratic" its forms of political competition. A "thicker" measure of democracy, represented by the squiggly grey line with the ribbon, is also depicted -- the Unified Democracy score, which aggregates information from various attempts to measure democracy in a consistent way -- and scaled to fit in the same interval. Polity and the UD scores agree on the basic pattern, though the UD scores do not see Argentina's democratic institutions as fully consolidated by the end of 2012 (the last year of the UDS dataset); Argentina does not achieve the highest scores (which would put it bumping against the right side of the graph), and appears to be trending slightly leftwards as of 2012 (less democratic in this graph; no political implication intended). The blue line with dollar numbers represents Argentina's annual per capita GDP, as estimated by Angus Maddison and his successors: Argentina is a solidly middle-income country by 2010.

As we move down further, we encounter the end of the last military government, shortly after the end of the Falklands war, in 1984; the caretaker Bignone presides over the extrication of the military from government after Galtieri, who was mainly responsible for the war, is forced to leave office by his military colleagues. The period before that is one of coups and overall economic stagnation; more generally the pattern of Argentine history over the previous couple of decades is one of continual conflict in the context of boom and bust economic cycles, as we can see by the number of coups, irregular leader exits, and the conflict with the ERP. This is the time of the "dirty war," though it's worth stressing that it was also a period in which divisions within the military were exacerbated by the conditions of Argentine politics; most coups in the period replaced military leaders, not democratically elected leaders. As we move down (back in time), we see the traces of the "impossible game" between Peronistas and the military Guillermo O'Donnell described in his classic analysis of bureaucratic authoritarianism. Periods of repression alternate with classic populism in which the Peronistas are allowed to compete for power, each side of the conflict attempting to consolidate its advantages by transferring resources to its supporters in ways that always proved to be unsustainable given Argentina's dependence on the vagaries of foreign trade (represented by the generally flat trend in GDP, with many ups and downs); but no one ever fully succeeded in fully consolidating power before the terms of trade turned, inflation went haywire, and social conflict instigated either military withdrawal or military intervention. As we move deeper in time, we find that the period of instability really began in the 1930s, with the overthrow of Irigoyen, when Argentina is already a relatively rich country. Before the 1930s we find stability at a lower level of democracy: Irigoyen was preceded by a long sequence of leaders who left office in a regular manner without being overthrown by the military. We might thus speak of a "great cycle" of macropolitical instability from the 30s to the mid 80s, which probably had something to do with the way in which Argentina became integrated into the world economy (according to my meager reading, at least), though the decisions of successive governments as they attempted to consolidate their bases of support -- repression, coups, particular monetary and fiscal policies -- seem to have exacerbated the conflicts of the period.
Because I have a bad memory for people and dates, I like these pictures as aide-memoires, though of course they will only make full sense if one knows a little about the political history of the countries depicted. It's also worth stressing that the datasets involved have gaps and other problems. Though the universe of successful coups since 1945 is pretty well covered, for example, some "unsuccessful" coups never get reported, some coup-like events are not included due to ambiguity, and of course we do not see here spikes of nonviolent protest aimed at changing the norms of political competition (one could use the NAVCO data for this, but I had to stop somewhere, and the graphs are overcrowded enough already). The GDP data is sometimes dubious or interpolated, especially for some of the poorest countries, and of course it does not show the full the range of issues affecting living standards.
And Archigos stops at 2004 (though it's being updated), providing sometimes a false picture of stability for some countries over the last decade. [Updated: now using data to the end of 2014]

Nevertheless, more auto-generated political histories for 173 countries in the Polity dataset are available in the GitHub repository for this post. One can take a look at some really eventful histories, like those of Haiti and the Dominican Republic, which are full of irregular leader exits; or at Venezuela, which shows both the period of democratic consolidation following the overthrow of Perez Jimenez, marked by several coup attempts, and the long economic decline preceding the rise of Chavez; or indeed, any number of others. In general, one pattern emerges from these more detailed pictures, namely that there are two basic forms of stability: the kind that comes about when a single person achieves full personal power and successfully "coup-proofs" his rule (e.g., Trujillo in the Dominican Republic, Duvalier in Haiti, Gomez in Venezuela) and the kind that comes about when some norm of political competition is expected to be enforceable even at the death of the ruler. The first kind of stability is clear when you see a spike of coups, conflicts, constitutional crises, or irregular leader exits that signal some sort of succession crisis - a sure sign of a previous personal regime. It seems really difficult to transform regimes based on loyalty to a person into regimes where impersonal norms of political competition have "bite"; the instability after the overthrow of Gaddafi is more the rule than the exception, regardless of whether the leader was overthrown or died peacefully in office.

Let's look at coups in more detail, because they are perhaps the most dramatic single event in the data - a single short spike in these spectral lines. The first thing to note is that they are associated with lower measured levels of democracy:
 
In other words, coups have historically occurred most often in already non-democratic regimes; a famous coup against a democratically elected leader like the ouster of Allende in Chile appears to be less common than the many forgotten coups against military regimes all over the world. (Iraqi Prime minister Abu Zuhair Tahir Yahya is reported to have said in 1968, "I came in on a tank, and only a tank will evict me," according to Luttwak's classic handbook on the coup d'etat; most coups in the postwar era seem to have been against people who came in on tanks). Few coups take place against the "consolidated" democratic regimes, which is simply another way of saying that norms of political competition in such countries are recognized as binding by all powerful parties. But we also see few coups against the most autocratic regimes, which are typically regimes where a party or an autocrat has fully coup-proofed their rule.

Coups are thus a symptom of normative fluidity, while both fully autocratic regimes and consolidated democracies are consolidated precisely because their norms of political competition are not fluid, as Finer saw in his classic study of the subject. This is why one of the best predictors of the risk of a coup is another recent coup; "the claim to rule by virtue of superior force invites challenge; indeed it is itself a tacit challenge, to any contender who thinks he is strong enough to chance his arm" which "succinctly explains one of the most usual consequences of a military coup, namely a succession of further coups by which new contenders aim to displace the first-comers. 'Quitate tu, para ponerme yo,' runs the appropriately Spanish proverb." (the quote is from Finer, The Man on Horseback, pp. 17-18; for the statistical evidence, see here).

Most coups nevertheless result in some immediate reduction in the level of democracy as new leaders attempt to consolidate their power (and thus engage in repression), but especially since the end of the cold war, many coups are on average followed a few years later by some degree of democratization (or re-democratization). The classic case was the "revolution of the carnations" in Portugal which overthrew the "Estado Novo", and which led to the modern democratic regime there. Though not every coup today is a liberalizing coup, in general there has been more pressure for countries to hold elections and less tolerance for overt military rule since the 1990s, as Marinov and Goemans argue in detail. Given the dependence on aid of many coup-prone countries, this has typically resulted in quicker democratization after a coup than before the end of the cold war, where dictatorships of various kinds could count more consistently on various forms of superpower patronage. The figure below shows the aggregate pattern quite strikingly:
It's also worth noting that over the post war period coups did not always lead to military rule; on the contrary, they often issued in power struggles that led to personal dictatorships or other forms of authoritarianism. Indeed, "pure" military rule has been quite rare and short-lived in the modern period (characterized by professional militaries rather than military aristocracies); as Finer noted, and later research seems to confirm, some of the very features that give militaries in certain societies the ability to seize power make them particularly unsuited to ruling these same societies without extensive civilian collaboration, and in any case direct military rule tends to exacerbate divisions in the organization.

Using data gathered by Geddes, Wright, and Frantz on regime types, focusing on whether the main institutions of the regime are the military, a single party, a monarchy, or some combination of the three, and on the degree of "personalism" in the regime, we can use it to look at which coups were followed by periods of rule by the military as an institution:
As we can see, the periods of pure military rule (in blue) and mixed military rule (in green; this includes regimes that used a civilian party or where power was also highly concentrated in the leader rather than in a Junta) are surprisingly few; most coups have led to non-military dictatorships, especially personal ones. (Small quibble: the Geddes, Wright and Frantz data shows the difficulties of the enterprise of classification, and the ambiguities of political reality. For example, they classify the Franco regime as a "personal" dictatorship for its entire period; but any student of the Franco regime can tell you that power fluctuated, with the Falange and the military much more powerful early in the regime, though there is clearly a sense that power was highly concentrated in Franco early on as well. I would have classified the Franco regime as a hybrid military-personalist regime).
Coups are more common in poor countries, as one might have expected:
 
But how, exactly, does poverty matter? After all, some surprisingly rich countries have experienced lots of coups, while some very poor countries have had little recorded instability of any kind. Consider this picture, which replicates the first graph of this post, except that the countries are arranged from poorest to richest, and the squiggly line in the middle represents GDP per capita:
Here we see many high-middle income countries that were plagued by coups in the past and sometimes still today (Argentina, Thailand, Syria, Qatar) while some extremely poor countries have never experienced coups (e.g., Malawi). Poverty seems to matter only where authority norms find few organized defenders, or rulers have failed to coup-proof their regimes; and this only because very poor societies seem to have been commonly places where the only organized force of national stature has been the army, and coup-proofing is tricky political work requiring resources that are not always available. (Finer's views are still quite reliable here, though he tends to speak too much of "legitimacy" when he really means organized support; it's not that poor people welcome coups or military rule, but that in poor societies the organized groups that have power are often incapable of resisting the army, and in twentieth century contexts powerful groups have had many different views over which authority norms should prevail).

Interestingly, though poverty is strongly associated with coups (and is typically found to be a significant risk factor in quantitative studies), economic growth is not so strongly associated; it is actually quite hard to find a significant effect of growth on coups in the quantitative literature, despite the fact that it's easy to tell stories about how economic decline might be a trigger of political instability. Though coups have clearly happened in periods of both growth and decline, one could nevertheless squint at the distribution of growth rates in years with coups and conclude that coups have tended to happen in years with slightly lower growth rates than average:
Indeed, it is not even clear that coups result in lowered growth rates in their aftermath (though as far as I can tell the statistical evidence suggests coups typically lead to some decline in growth rate). Consider this picture, showing normalized GDP (100 at the year of the coup) in the years before and after a coup or coup attempt (successful coups are in red, unsuccessful attempts are in blue):
In some cases, we see a U-shaped pattern - economic decline followed by coup, followed by recovery later; in others we see a line sloping down, and in others we see a line sloping up. Coups have happened when income was growing greatly (Libya), and when income has been declining greatly (Iraq, Chile); in periods of recurrent boom and bust cycles (Argentina) and in periods of apparent macroeconomic stability (Thailand, Greece). Sometimes they have been followed by quick recoveries, others by wild fluctuations; ten years after the Pinochet coup Chilean GDP was at the same level as in 1973, though it had oscillated wildly in the intervening period. The key point seems to be that coups are symptoms of underlying political conflict, which may be triggered by factors other than economic instability; even in the Argentine case, where coups where recurrently triggered during economic crises, the problem seems to have been the political conflicts (strikes, riots, etc.) that often came with the economic crisis and that made the military frame the situation in security terms. Thus the relationship between coups and economic growth will depend on the relationship between political conflicts and economic life.

Nevertheless, the macroeconomic aftermath of coups also seems to have varied from before and after the cold war, in line with the Marinov and Goemans thesis mentioned above:
Coups before the cold war on average seem to have happened in periods of growth, and were not necessarily followed by economic recession; coups afterwards seem to have happened on average during periods of severe economic contraction and to have led to further declines. Perhaps this shows that coups have been punished more severely in the post Cold war era, so that only severe economic crisis has led to coups after 1990; or that coups during the cold war happened more often in countries where economic performance is more or less independent of political stability (e.g., oil-dependent countries, like Iraq). But I found the lack of obvious connection between political instability and economic instability striking.

I think overall it is probably fair to say that some forms of macropolitical instability (coups, irregular leader exits, regime transitions involving major normative changes, like transitions from monarchy to democracy) seem to be on the wane. But there is little in this history suggesting that such instability ever definitively ends; on the contrary, though some countries have good long runs of stability, big shocks to the global system (big economic changes, big wars) can trigger periods of instability with very long after-effects. This is probably a bit depressing; it suggests that the events started by the Arab uprisings, for example, will take a long while to work themselves out (mostly in ways that involve "political instability"), until a new normative equilibrium is eventually reached.

Code for all the graphs in this post is available at this Github repository. The vast majority of the code is basically data-munging; you will need to download some of the datasets separately.

(Update, 1/21/2014: minor changes in wording to improve clarity)

(Update, 1/24/2014: using Archigos data for 2014 now)

Sunday, December 08, 2013

The Age of Democracy

(Part of an occasional series on the history of political regimes. Contains some work in progress.)

This is the age of democracy, ideologically speaking. As I noted in an earlier post, almost every state in the world mentions the word “democracy” or “democratic” in its constitutional documents today. But the public acknowledgment of the idea of democracy is not something that began just a few years ago; in fact, it goes back much further, all the way back to the nineteenth century in a surprising number of cases.

Here is a figure I've been wanting to make for a while that makes this point nicely (based on data graciously made available by the Comparative Constitutions Project). The figure shows all countries that have ever had some kind of identifiable constitutional document (broadly defined) that mentions the word “democracy” or “democratic” (in any context - new constitution, amendment, interim constitution, bill of rights, etc.), arranged from earliest to latest mention. Each symbol represents a “constitutional event” - a new constitution adopted, an amendment passed, a constitution suspended, etc. - and colored symbols indicate that the text associated with the constitutional event in question mentions the word “democracy” or “democratic” (see data and methods note below for more details):


(Red lines indicate, from left to right, the date of the first mention of the word “democracy” or “democratic” in a constitutional text, WWI, WWII, and the end of the Cold War [1989]).

The earliest mentions of the word “democracy” or “democratic” in a constitutional document occurred in Switzerland and France in 1848, as far as I can tell.[1] Participatory Switzerland and revolutionary France look like obvious candidates for being the first countries to embrace the “democratic” self-description; yet the next set of countries to embrace this self-description (until the outbreak of WWI) might seem more surprising: they are all Latin American or Caribbean (Haiti), followed by countries in Eastern Europe (various bits and pieces of the Austro-Hungarian empire), Southern Europe (Portugal, Spain), Russia, and Cuba. Indeed, most “core” countries in the global system did not mention democracy in their constitutions until much later, if at all, despite many of them having long constitutional histories; even French constitutions after the fall of the Second Republic in 1851 did not mention “democracy” until after WWII. In other words, the idea of democracy as a value to be publicly affirmed seems to have caught on first not in the metropolis but in the periphery. Democracy is the post-imperial and post-revolutionary public value par excellence, asserted after national liberation (as in most of the countries that became independent after WWII) or revolutions against hated monarchs (e.g., Egypt 1956, Iran 1979, both of them the first mentions of democracy in these countries but not their first constitutions).

Today only 16 countries have ever failed to mention their “democratic” character in their constitutional documents (Australia, Brunei, Denmark, Japan, Jordan, Malaysia, Monaco, Nauru, Oman, Samoa, Saudi Arabia, Singapore, Tonga, the United Kingdom, the USA, and Vatican City).[2] And no country that has ever mentioned “democracy” in an earlier constitutional document fails to mention it in its current constitutional documents (though some countries in the 19th and early 20th centuries went back and forth - mentioning democracy in one constitution, not mentioning it in the next). Indeed, after WWII the first mention of democracy in constitutions tended to be contemporaneous with the first post-independence constitution of the country; and with time, even countries with old and settled constitutional traditions seem to be more and more likely to mention “democracy” or “democratic” in some form as amendments or bills of rights accumulate (e.g., Belgium in 2013, New Zealand in 1990, Canada in 1982, Finland in 1995). The probability of a new constitution mentioning “democracy” appears to be asymptotically approaching 1. To use the language of biology, the democratic “meme” has nearly achieved “fixation” in the population, despite short-term fluctuations, and despite the fact that there appears to be no particular correlation between a state calling itself democratic and actually being democratic, either today or in the past.[3]

Though the actual measured level of democracy around the world has trended upwards (with some ups and downs) over the last two centuries, I don't think this is the reason why the idea of democracy has achieved near-universal recognition in public documents. Countries do not first become democratic and then call themselves democracies; if anything, most mentions of democracy seem to be rather aspirational, if not entirely cynical. (Though many constitutions that mention democracy were also produced by people who seem to have been genuinely committed to some such ideal, even if the regimes that eventually developed under these constitutions were not particularly democratic). What we see, instead, is a broad process in which earlier normative claims about the basis of authority - monarchical, imperial, etc. - get almost completely replaced, regardless of the country's cultural context, by democratic claims, regardless of the latter's effectiveness as an actual basis for authority or the existence of working mechanisms for participation or vertical accountability. (These democratic claims to authority also sometimes coexist in uneasy tension with other claims to authority based on divine revelation, ideological knowledge, or tradition, invented or otherwise; consider the Chinese constitution's claims about the “people's democratic dictatorship” led by the CCP).

I thus suspect the conquest of ideological space by “democratic” language did not happen just because democratic claims to authority (especially in the absence of actual democracy) have proved more persuasive than other claims to authority. Rather, I think the same processes that resulted in the emergence of modern national communities - e.g. the rituals associated with nationalism, which tended to “sacralize” a particular kind of imagined community - led to the symbolic production of the nation not only as the proper object of government but also as its proper active agent (the people, actively ruling itself), regardless of whether or not “the people” had any ability to rule or even to exercise minimal control over the rulers.[4] There thus seems to have been a kind of co-evolution of symbols of nationality and symbols of democracy, helped along by the practice/ritual of drafting constitutions and approving them through plebiscites or other forms of mass politics, a ritual that already makes democratic assumptions about “social contracts.” The question is whether the symbolic politics of democracy eventually has any sort of impact on actual institutions. But more on this later.

Data and Methods


The underlying texts used to construct this figure have been gathered by the Comparative Constitutions Project. What “counts” as a constitutional document is subject to some debate, especially in countries like the UK or New Zealand that are sometimes said not to have a written constitution. But all of the documents gathered by the CCP are indisputably important, describing basic structures of government and setting out the rights of citizens. Unfortunately, however, most are not publicly available through the CCP repository due to copyright complications. I thank Zachary Elkins, one of the CCP Principal Investigators, for granting me access to them; I also want to note that the work of the CCP in collecting, categorizing, and coding them is invaluable (and hopefully may soon be more widely accessible, with the Constitute website).

Anyway, in order to create the figure above, I downloaded the PDFs of all the documents in their archive and extracted the text of as many as I could using the Python PDFminer library. (Some of the older constitutions have not been OCRd, and a few are password-protected, so there's no text for them; see the “inventory” file for details). I then used this R script to extract each mention of the word “democracy” in each of these texts. Specifically, I identified each line that contained the pattern “democ” or “demok” or “mocra” or “demo-” in every extracted text file (not all of the available texts are in English, but the word “democracy” has similar roots in most European languages at least), as well as the previous and the following line, and put them in a table. I then inspected this table for false positives - instances where the algorithm picks up the word “democracy” in cases where it isn't actually mentioned in the constitutional text, or instances, mostly in poorly-OCRd Cyrillic texts, where the algorithm picks up words that contain the pattern “mocra” but are not “democracy” or “democratic” (or any variant). The exact list of false positives I found is available in the script, as well as all the changes made to the original list of mentions. Finally, I calculated earliest and latest mentions of democracy (as well as a few other variables). The resulting dataset of democracy mentions plus all code (including the code for the figure in this post), is available in this GitHub repository.


Notes


[1] It is possible that there is an earlier mention of democracy in the data; I have not manually checked every earlier constitutional document, and some of them are poorly OCRd and not in a major language. But France and Switzerland seem right.

[2] Some mentions of democracy occur only in passing, as in New Zealand, where a 1990 bill of rights (coded by the CCP as an “amendment” to New Zealand's constitution) has a section on “democratic and civil rights” and indicates that restrictions on rights must be demonstrably justified in a manner appropriate to “a free and democratic society.” One could easily come up with a story linking most of the countries that do not mention democracy: it's basically countries whose constitutional documents are still strongly influenced by a UK or USA constitutional legacy in Asia, due to a relatively stable post-colonial or post-war history (e.g., Malaysia, Singapore, Japan) and monarchies whose sovereigns are still relatively unconstrained (e.g., Saudi Arabia, Oman, Tonga).

[3] This is tricky to check with an actual measure of democracy for a variety of reasons (though I'm working on it), but at least today there's no correlation. I do wonder whether a long history of mentions is correlated with democracy today - aspiration becoming reality, as it were - or whether the correlation between mentions of democracy and actual levels of democracy has varied through time (perhaps the language of democracy once meant something but today it does not, for example).

[4] For a fuller academic argument on this point, see my piece on “Models of Political Community” here. I think a similar process once took place in the late Roman Republic, as I argued in a piece on “Cicero's Conception of the Political Community” [ungated here]: Cicero almost came to the idea of a “national” state and “representative” institutions.

Update 9 December - minor edits for clarity; fixed some typos.

Friday, July 12, 2013

Inequality Regimes and Rawlsian Growth Rates: Some thoughts on the evolution of inequality 1960-2010, with special reference to Venezuela

(Mostly an excuse to play with the Standardized Worldwide Income Inequality Database, compiled by Frederick Solt, which I just discovered. This post also belongs, loosely speaking, to my long-running series on the quantitative history of political regimes. R code for everything in this blogpost available in this Git repository; you would need to download the dataset separately).
Inequality is difficult to measure. Socially relevant inequalities are manifold, and measurable inequalities in money income are not always especially important. (In the formerly communist states of Eastern Europe income was very evenly distributed; yet this did not mean that there were no important social inequalities). Even inequality in money income is not easy to measure properly. Most existing data is not very comparable accross countries or years, and it is often not even clear to what income concept the sorts of inequality measures people typically use to make a point in political discourse refer to: does it refer to after-tax, after-transfer income or to "market" income? Does it refer to individual or household income? What sorts of things are counted as "income"? How do we account for access to high-quality public services? At best, measures of income inequality are uncertain estimates of an unknown distribution of potential living standards, more or less valid for societies where "money income" is a useful proxy for the ability of people to enjoy various important goods, and of little value outside the context of a conception of a "just distribution" of these capabilities.
Despite the fact that estimates of what is essentially a statistical abstraction often play surprisingly big roles in current political debates (cf. the debate over The Spirit Level some years ago, or recent concern about a rise in New Zealand's gini index), I have recently become more skeptical about the importance of measured income inequality in politics: whatever importance the actual distribution of incomes has for political life in a society, it has to be mediated through complicated processes that refract local lived experience through the prism of context-dependent fairness norms that are only vaguely related, if at all, to the numbers used to measure its skewness.
Yet I'm curious: what sorts of income inequality have in fact increased, and where? How might these changes have mattered? Enter a new and shiny dataset: the Standardized Worldwide Income Inequality Database, which promises to ameliorate some of these measurement problems. The database uses the Luxembourg Income Study - very high quality income inequality data - to calibrate the much larger but less comparable United Nations University World Income Inequality Database. The result: lovely long time series estimates of both the market and the after tax, after transfer (net) gini index of inequality, including standard errors, for 153 countries. My first though on learning about this was: graphs! (Hopefully some non-obvious facts are also involved below).
Let's start by looking at a country that has often been cited as a great success in reducing inequality: Venezuela during the Chavez years. (Also, I was there recently visiting family after a long absence, and I have a personal interest in understanding the changes that have occurred during that time). One question I've been curious about concerns the evolution of inequality in Venezuela relative to other Latin American countries, especially since the coming to power of Chavez in 1999. How do changes in inequality in Venezuela compare to changes elsewhere?
In the following plot, we see changes in both the market ("equivalized (square root scale) household gross (pre-tax, pre-transfer) income", if you must know) and the net gini index of inequality (after tax, after transfer) in 19 Latin American countries from 1999 until 2010, ordered by the estimated rate of inequality reduction (countries that reduced inequality faster appear earlier; read the graph from right to left, top to bottom):
plot of chunk LatinAmericanTrendsInequality
Inequality in Venezuela has indeed decreased relatively quickly since 1999 - the second fastest decrease after Ecuador, which has also had left-leaning governments (though a far more unstable political context, with five different presidents since 1998). Three things are worth noting about the context of these trends, however.
First and most important is that this reduction in inequality is not driven by direct redistribution: there is barely any difference between the "market" gini index (our measure of inequality before taxes and transfers) and the "net" gini index (our measure of inequality after taxes and transfers). To the extent that the reduction in inequality is the result of government action rather than something else, it must have come about through measures like investment in human capital and labor market policies (see Morgan and Kelly 2012, ungated here, for the proper peer-reviewed argument). This is true of all Latin American countries save for Puerto Rico (which is part of the USA in a sense) and (to a lesser extent) Brazil; indeed, redistribution in some countries (Peru) appears to have perversely increased inequality.
Second, most Latin American countries have experienced reductions in inequality during this period, though most remain highly unequal. But Venezuela was already among the most equal countries in Latin America; in 1999, only Uruguay and Costa Rica had lower measured inequality (and the difference in net gini was within the margin of measurement error, so it should probably be disregarded). This surprised me; I had expected higher levels of inequality in Venezuela when compared to other countries, given the level of class conflict on display during the Chavez era. More surprisingly perhaps, if we take a broader look we discover that inequality in Venezuela appears to have been remarkably stable over the past fifty years, fluctuating around a flat trend:
plot of chunk LongerRunVenezuelaInequality
(Lines around dots represent 95% confidence intervals).
In fact, the low level of inequality in Venezuela as of 2010 only returned the country to the level of inequality it last experienced around ... 1992, the year of the February coup which made Chavez famous, and three years after the "neoliberal" paquete of 1989 (which was supposed to have triggered the Caracazo). Inequality did increase after 1992, and poverty had increased before then - the Venezuelan economy had been in decline for a while, as we can see below. Which all goes to show, I suppose, that political unrest and lived experiences of injustice are only very loosely connected, if at all, with measures of income inequality; whereas austerity and large income losses appear more immediately important to political outcomes (as Jay Ulfelder argues here):
plot of chunk LongerRunGDPPerCapitaVenezuela
(GDP per capita data from the Penn World Table v. 8.0).
Finally, it's probably worth noting that Venezuela's economic fortunes are deeply tied to oil prices, and that the rapid reduction in inequality in the last decade or so should also be placed in the context of the very large rise in the value of oil and gas during this period. Here is an estimate of the per capita value of oil and gas exports for Venezuela, from Michael Ross' oil and gas dataset:
plot of chunk OilAndGasData
In fact, Venezuela and Ecuador, the countries that have experienced the fastest inequality decreases, have been precisely the two countries that have benefitted the most from oil and gas price increases - money that flows directly to the state (especially since the Chavez government systematically asserted control over the state oil company) and can be used to provide employment and subsidize education, healthcare, housing, staples, and other goods, however inefficiently (e.g., the varios "Misiones" and other social programs created by the Chavez government). At least some of these programs must have played some role in the reduction of inequality, but given the amount of oil and gas money flowing directly to the Venezuelan state (representing most Venezuela's exports, which have become substantially less diversified over the last 15 years) and the typical patterns of clientelism and electoral politics in Venezuela it would have taken a bloody-minded kleptocrat not to reduce inequality by some amount. At any rate, inequality and poverty also diminished quite a bit during the 1970s oil boom, likely through similar channels - massive amounts of money flowing through the state, which increased its ability to employ people and subsidize public services. (I don't mean to sound grudging; though I have doubts about the effectivenes of some of these programs, some of the new housing built during the Chavez years looks decent, for example).
Let's take a broader look, however. How does the Venezuelan experience of inequality reduction compare to some countries outside of Latin America? Just because they've been in the news, let's look at the Venezuelan experience in coparison to Turkey and Egypt; and add the USA and New Zealand to see how two "developed" countries look as well.
plot of chunk ComparisonOutsideLatam1
That's right: Egypt and Turkey apparently reduced inequality faster than Venezuela in this period (though the error estimates of the gini index for both are also larger), and were less unequal than Venezuela by the end of the period! Also, despite the fact that the degree of "market" inequality was higher in the USA and NZ than in Venezuela, and did not decrease or even increased a little during this period (as measured by the net gini index), both countries remain less unequal than Venezuela (as measured by the net gini index), due to the effectiveness of their redistributive measures.
Now, this is perhaps surprising, but a bit of an aberration, and really, we are dealing with imperfectly estimated quantities (rates of decline) based on measurements with error. So there's really no point in arguing about whether inequality in Venezuela has in fact decreased faster than in Egypt or not; our methods of measuring inequality don't allow us to give a very precise answer to this question (error bars are large, etc.). In any case, it is clear that income inequality has declined pretty fast in Venezuela over the last 15 years, even allowing for some meaurement and estimation error, as we can see by calculating the trend rate of change in the net gini coefficient (the slope of a regression of log(gini_net) on year, to be technical, which yields the estimated trend annual percent rate change in the gini index) for all countries in the dataset:
plot of chunk ComparisonOutsideLatam2
(I took out countries that had too few datapoints, since the trends didn't look to me like they could be informative. The error estimates in the graph are nevertheless probably too small, since one would need to use the proper rules for error propagation to calculate them, which I have not done. Interestingly, the estimate of the rate of change in the net gini index for New Zealand and the USA since 1998 suggests basically that they have experienced no significant change in measured inequality from 1999 until 2010, contrary to popular belief; their important increases in inequality occurred earlier. More on this in a minute).
What strikes me about this graph is that countries that have achieved very fast reductions in inequality over this period appear to be quite disparate; though left governments are in evidence among these, many countries apparently achieved fast reductions in inequality with supposedly "neoliberal" policies (e.g., Egypt and Turkey) that are now in turmoil. Maybe this is evidence that the gini index does not capture socially relevant changes in inequality; but then it would also fail to capture changes in inequality in non-neoliberal Venezuela and Ecuador. (Of course, other confounding factors may be at work too).
It is also curious that many of the fastest reductions in inequality have occurred in states that do not engage in a lot of explicit redistribution. In fact, a simple correlation between the average redistributive capacity of a state (measured by the percentage difference between the "market" gini and the net gini coefficient) and the rate of decrease in measured "final" inequality over the period is slightly negative (so fastest reductions in inequality have occurred in states that are unable to affect market gini very much at all, or that even increase it through perverse redistribution):
plot of chunk RedistributionReductionRateCorrelation
It's probably not worth making too much of this correlation (measurement errors, the relatively short time period under consideration, and confounding factors are not taken into consideration), though it does suggest that many changes in inequality seem beyond the control of most governments. But even when we expand the period of observation all the way to 1960, the correlation does not entirely disappear, though it weakens greatly:
plot of chunk RedistributionReductionRateCorrelation2
Ultimately, however, the more directly and explicitly redistributive the state has been, the more equal it also appears to be over the long run:
plot of chunk RedistributionInequalityCorrelation
Or, to put it crudely, since 1960 at least market inequality has only been reliably reduced in states that take from the rich and give to the poor. And yet actually taking from the rich and giving to the poor seems to put nontrivial demands on state capacity and political life (witness the existence of robber states that take from the poor and give to the rich). The degree of change in the market distribution of income even appears to be a fair measure of that capacity; from the graph above, it's likely that a state that can consistently reduce gini index of market inequality by at least 30% is a pretty "strong" state (in the "infrastructural" sense of strong), whereas a state that cannot make a dent on the market distribution of income is more likely to be "weak" (with some communist exceptions like the USSR that did not engage in a great deal of explicit redistribution, since, to put it crudely the state owned everything and everyone more or less got paid the same).
And abilities to redistribute income appear to be remarkably "sticky." Few countries appear to become more able to affect the gini distribution over time:
plot of chunk StickinessOfRedistributiveCapacity
(I've deleted cases with very few data points to make the graph look prettier. See the code for the details). What is striking about this graph is how stable the redistributive capacity of most states has remained over a period of more than six decades: many countries show basically zero change in their ability to change the income distribution. To be sure, some countries have increased their redistributive capacity -- France is a good example -- and others experience wild swings in redistributive capacity, probably related to big political conflicts -- note Bangladesh and Chile, the latter with a big bump around the time of Allende. But at best we can detect a long-term decline in redistributive capacity for the majority of cases (even if the decline is often slight); and often, after a decline, we see long periods of stability rather than change: countries settle into an "inequality regime," with some occasional big bumps which indicate new equilibria.
Note that in many cases the redistributive capacity of the state does not change even while inequality increases: thus, for example, while the net gini has increased over the past six decades in the USA and New Zealand, their capacity to affect the gini coefficient has remained approximately the same (New Zealand has been able to reduce the market gini by about 27%, though there's a slight downwards trend in this number; the USA by about 22%). The structure of their economies changed (by political action, in part), producing more inequality, but their redistributive capacity as states remained basically the same. To decrease inequality by redistribution in cases where the market gini increases substantially seems to require either a big political shock, or a long-run increase in state capacity.
There is another historical pattern that struck me as interesting: both levels of inequality and redistributive capacities seem to be highly correlated accross regions. Neighboring countries appear to have both similar levels of inequality and similar redistributive capacities. Linked economic and political histories seem to produce both the equilibrium level of inequality and the long-run redistributive capcity of the state.
Here, for example, we see the average redistributive capacity of states per region:
plot of chunk RedistCapacityPerRegion
(Cases to the right of the solid line are states that on average made their income distribution more equal; the dashed line indicates the median redistributive capacity).
And here is a graph of net gini per region (all observations since 1960):
plot of chunk GiniRegion
No great surprises here, perhaps: Sub-Saharan Africa and Latin America have been the world's most income-unequal regions over the last six decades, whereas Europe has been consistently equal - the home of both Northern social democracy and Eastern European communism, both of which have been able to keep the distribution of incomes relatively equal through explicit redistribution, though in somewhat different ways.
But perhaps this is of little importance. On one (vaguely Rawlsian) view, what matters is not the income distribution per se, but the ways in which it affects the prospects of the worst off in society. How much does it matter whether or not inequality declines in any given society, especially for the poorest? This will depend on the growth rate of the economy; high growth with declining inequality will be better for the poor than low growth with increasing inequality, though the outcome of the comparison is ambiguous for high growth with increasing inequality or low growth with decreasing inequality.
Now, it occurs to me that with the average income for these countries as well as their level of inequality, we can make an informed guess (technically, a wild guess) about the average income of various deciles for the years in which data is available. To do this properly would be too painful for a blog post, but I assume that empirical income distributions more or less fit a lognormal distribution (even though they fit more exotic distributions better, like the Singh-Maddala distribution or the generalized Beta distribution). With a little help from R, I can then simulate the average income of each decile of every country in the SWIID dataset. (Take a look at the code for the gory details. Also: this is a VERY rough and ready simulation, extremely inefficient to run and cooked up in a day. Do not take these numbers too seriously). We can then provide some vaguely informed answers to a Rawlsian question: which countries have most increased the prospects of the poorest over the last six decades?
The question admits of two more precise formulations, which we'll take on in turn: what countries have had the highest growth rate of income for the lowest deciles of the population? And second, in which countries do the poor have the highest incomes? (The first corresponds to a sort of dynamic version of the difference principle, which I find more interesting). Let's start with looking at the Rawlsian growth rate (the rate of income growth for the lowest decile, which we'll assume represents the group whose position must be maximized in Rawls' theory); the higher the long-run Rawlsian growth rate, the more the country fulfills the dynamic version of the difference principle. Though in theory the long-run growth rate of the economy as a whole and the long-run growth rate of the income of the lowest decile should perhaps converge, in practice they diverge, even over long time periods - some groups do well over some time frame, others do badly. Now, what we would actually want to know from a strict Rawlsian perspecive is the highest long-run growth rate of income for a representative person in the lowest decile of a given country relative to the potential growth rate of the whole economy (in other words, what degree of inequality would produce the highest income growth for that representative person, given the particular structure of that economy), but this is a counterfactual quantity we cannot estimate, so we'll make do with simulating the incomes of the lowest decile for the actual combinations of growth and inequality in existing economies. (I repeat my warning: this is only a simulation!)
First, we estimate the long-run Rawlsian growth rate (for countries with data going back far enough - so we drop countries that don't have long enough time trends, say at least 30 years):
plot of chunk RawlsianLongRunRates
The "Asian Tigers" unsurprisingly top the list: over the last six decades, Taiwan, Singapore, and South Korea had the highest (simulated) Rawlsian growth rate (in countries with at least 30 years of both GDP and gini data). South Korea and Taiwan are below average in inequality, which makes sense, but Singapore is not. Over the long run, in other words, a high enough growth rate of income seems to compensate for higher than average inequality. But one surprise among the top countries is Egypt - where the poorest decile, if we believe this simulation (and you shouldn't), had a pretty good run over many decades, despite Egypt not being considered a big performer in terms of its average per capita growth. At the bottom, by contrast, we find that Venezuela has essentially experienced zero Rawlsian growth over six decades (in fact, its long-run trend in regular per-capita annual growth is also zero). Though below average in inequality, its income has suffered so many ups and downs (mostly following oil price changes) that the trend is flat; no wonder Venezuelans eventually got tired of all their politicians before Chavez.
Now, there obviously is a correlation between Rawlsian growth and regular growth, as well as between Rawlsian growth and average inequality, but it is not perfect, simply because the Rawlsian growth rate is a function of both the average growth rate and the gini index by construction, and these two things are not perfectly correlated; a high enough growth rate in the whole economy can overcome a large gini coefficient to produce high Rawlsian growth rates and vice-versa. But it's worth noting that extremely high levels of inequality do appear to be associated with plain low growth over the long run, bad for both the poor and everyone else except perhaps tiny kleptocratic elites:
plot of chunk RawlsiantoAverage
We can now repeat the exercise for the last 15 years and see how Venezuela stacks up since then:
plot of chunk RawlsianLongRunRatesSince1999
As we can see, the Chavez years (up to 2010; the data does not tell us what happened for the last three years) were quite good for the poor, according to this simulation: the combination of declining inequality and relatively high growth rates (due in great part to rising oil prices) made Venezuela a top ten Rawlsian performer - better even than China, which also had torrid growth rates but increasing inequality during this period. To be sure, this good "Rawlsian" growth rate is only relevant if we ignore the equal liberties principle, which from a strict Rawlsian perspective  is meant to have priority over the difference principle; and increasing disregard of classic liberal rights during this period counts against Venezuela. (I vaguely wondered whether perhaps a "Rawls index" could be constructed, using data like the UDS to measure compliance with the first principle, fair equality of opportunity using the gini index, and the difference principle using the rate of growth of the income of the lowest decile; but since the two principles are supposed to be lexicographically ordered, a combined Rawlsian index would be pointless, useful only if we relax that assumption. Nevertheless, if we relax that assumption, then we would have to face the question of how much the improvement in the condition of the least well off ought to count against the decline in the "equal liberties" of the first principle; and I don't know of any good principled answer).
At the same time, it is interesting to note the countries at the very top are not precisely all left-wing governments; Azerbaijan, Mongolia, and Ukraine appear there. This may be because the simulations are risibly wrong (an important possibility), or the data are wrong; or simply that policies of the kind the Chavez government tried out are not the only possible ones to bring about growth in the income of the poor (and now, with high inflation, sporadic shortages, a large black market premium for dollars, and other problems, they don't look especially sustainable either). Nevertheless, the high Rawlsian growth rate makes it easy to understand why many of the Venezuelan poor felt that Chavez improved their position, regardless of how much responsibility we ought to attribute to his government for that outcome, or how sustainable its policies may be with lower oil prices.
Regardless, a good growth rate for the poorest decile matters: if inequality had remained at its maximum level during the Chavez years instead of declining but the growth rate had stayed the same, I estimate that the a representative of the poorest decile would have earned about $2000 less over the entire period than they actually did. We can call this quantity the "Rawls gap": the amount of income the poorest decile would have gained (or lost) in a given period had inequality remained the same as at the beginning of the period. Of course, since the growth rate would have been different had inequality remained the same, this is merely a fiction; we can't really estimate this counterfactual.
Nevertheless, just for fun, here is the Rawls gap for Latin America, per year:
plot of chunk RawlsGap
This allows us to say that in Venezuela, the reduction of inequality that occurred during the Chavez period (assuming, per impossibile, that the growth rate would have stayed exactly the same had inequality remained at the 1999 level) gained a representative person in the poorest decile a total of about $1500-$2500 over 10 years, or about $200 per year, whereas the increase in inequality over the same period in Costa Rica cost a representative person in the poorest decile about $800-$1200 in income, or about $100 per year. This is nothing to sneeze at for the poorest decile (whose average yearly income is only about $3000 per year).
(It's kind of fun, though conceptually pointless and computationally expensive in my system given my crappy code, to calculate various Rawlsian gaps for arbitrary years and countries; for example, the "Rawls gap" for NZ is something like $2000 per year lost in income for the poorest decile if we assume the same growth trajectory but the level of inequality of the early 80s. Which of course we shouldn't - had inequality remained the same, the growth trajectory would have been different. As Adam Przeworski has said, everything is endogenous).
(We could also imagine even more exotic quantities, though I have no time to test them out here. Consider the Rawlsian compensatory growth rate, for example. This would be the growth rate that would compensate the poorest decile for an increase in inequality: if we want to say that some reform x would lead to higher income growth but higher inequality, then the compensatory Rawlsian growth rate is the growth rate where the income growth rate of the poorest decile at the higher level of inequality is identical to their income growth rate at a lower level of inequality but a lower overall growth rate for the economy; you would need a reform to produce at least the compensatory Rawlsian growth rate for it to be justified in terms of the difference principle. Which you may of course think is bogus).
Now, absolute incomes matter too; the difference principle in Rawls is not usually understood in terms of growth rates (though I think that should be the more natural interpretation). But the second version of the Rawlsian question above (where do the poor have the highest incomes?) has a much more obvious and boring answer: the Scandinavian countries, due to both generally high incomes and low levels of inequality due to high redistribution; and most of the countries at the top also score well in terms of the first principle (measured inexactly here by the UDS, which perhaps ought to be discounted a bit given recent developments in some countries). I include it here for completeness:
plot of chunk RawlsianCountriesSince1999-2
The roots of that ranking of countries are much older and deeper than this dataset allows us to see.
In theory, both the first ("equal liberties") and the second principle of Rawls' theory ("fair equality of opportunity" plus the "difference principle") ought to go together. In practice, however, Rawls himself thought that they did not always do so, though his reasons for thinking this were not always clear. Though I don't really have the tools to tackle the question of the relationship between liberal rights and the rest of the components of Rawls' theory properly (certainly not here), it looks as if we see a kind of inverted-U relationship in the data:
plot of chunk GrowthofPoorandDem
In other words, over the last half-century, the income of the poor has risen fastest under regimes that have not been on average highly democratic, but also has grown least in these regimes; non-democracy looks like a (potentially quite bad) gamble, though both democracy, long-run inequality, and the long-run growth rate of the income of the poor are probably determined by (or are a reflection of) some deeper social fact, like state capacity, which is not really susceptible to policy intervention. Whatever state capacity is (I have argued it is a kind of development of political technologies) it emerges out of political struggles that take a very long time to work themselves out with many tragic consequences along the way; and in any case the rate of improvement of state capacity is at times immeasurably low.

[Update 12/7/2013 - fixed a reference to a non-existing graph]