Showing posts with label history of political regimes. Show all posts

Thursday, December 05, 2019

Dictators

In my corner of Twitter, I recently became obliquely aware of a kerfuffle about Michael Bloomberg saying that “Xi Jinping is not a dictator”. (Twitter is funny that way: sometimes all you get is a trace of some public person’s comment as reflected in memes or snark, and it takes some effort to find the original motivation for the jokes. It’s like a cloud chamber for political events). Not that this blog has any interest in current affairs, but I thought I actually had something to say about the question of the terms we use to talk about non-democracy, and I haven’t written here in a while.

At one level, this is an entirely unimportant and uninteresting controversy. The term “dictator”, like all political terms, can obviously be used as a weapon in the endless skirmishes for positional advantage in American politics and culture; and failure to label Xi Jinping as a “dictator” is easily equated with support for the crackdown in Hong Kong and repression in Tibet, Xinjiang, and elsewhere in China.

Similar controversies often arose when Chávez was alive (was he a dictator?), and still do occasionally with other people as well (is Orbán a dictator? Putin? Erdoğan?). They all have a similar structure: the person denying “dictatorship” status focuses on some attribute of the leader in question that seems incompatible with a standard “image” of dictatorship – e.g., the lack of violence against particular people, free election to the post of president or term limits, formal or informal accountability to selected constituencies, popularity – while those arguing for dictatorship tend to focus on the non-democratic aspects of the system over which the leader presides (lack of freedoms, use of violence, lack of formal accountability to other constituencies, life tenure). Though these disputes are ostensibly about correct descriptions – is this person a dictator or not? – their (usually obvious) point is coalitional – does the person making the descriptive claim belong in this or that group? (Unsurprisingly, Chinese leaders themselves prefer not to be called dictators, despite the fact that the Preamble of the Constitution of the People’s Republic still straightforwardly endorses the “people’s democratic dictatorship”).

This is unavoidable and to be expected; ostensibly descriptive terms have always been used in cultural and political struggles to increase or decrease the status of people and places, and their meaning is therefore “essentially contested.” Moreover, because they have long histories of use in these struggles, all such terms become sedimented with multiple valences that are impossible to “bracket off”. When we talk about “democracy” or “dictatorship” we invoke a plenitude of historically accumulated meanings and values that cannot simply be wished away by appeal to the dictionary. Yet alongside the political use of these words there is also an analytic use. (I’m a Weberian; I still see a distinction between Wissenschaft and politics, so sue me). From this point of view, the proper analytical use of a term like “dictatorship” should be informed by its historical roots, which in turn point the way to certain core ideas, but cannot be identical with its current usage in political struggles.

The history of the word “dictatorship” is probably familiar to readers of this blog; indeed, I sketched it here a long time ago, and then wrote about it at more length in chapter 2 of my book. The name of an ancient Roman republican magistracy, a person temporarily entrusted by the Senate to “save the republic” in emergency situations without being encumbered by procedural niceties, it already had a bad odour by the time of Sulla. These connotations were further cemented by Caesar’s assumption of the office in perpetuum, but none of this mattered for a very long time, as dictatorship was associated with republics, and republican forms of government basically ceased to exist for many centuries afterwards in the West. (The word for a bad ruler in non-republican contexts was tyrant or despot, not dictator; as Hobbes caustically put it, tyranny was “monarchy misliked”).

Accordingly, “dictatorship” came again into common usage in English and other European languages the mid-19th century, and more clearly at the beginning of the 20th century, when “democracy” (republics with universal suffrage) became more fully established; dictatorship is the pathology of republics, not of monarchy. And initially at least users of the word harked back to its “positive” or neutral sense; José Gaspar Rodríguez de Francia in Paraguay even declared himself “perpetual dictator” in 1816. Dictatorship is also associated with the invention of terms like “Caesarism” in the 19th century to describe regimes like those of Napoleon III or Bismarck, which combined appeals to “popular” legitimation, republican forms, and authoritarian features; these were the first people in a long time that could be described as “dictators” in European politics, and writers looked back to the analogy with Caesar to think about them.

When Marx and Engels appropriated and positively valorized the idea of the “dictatorship of the proletariat” (a term coined by Marx’s associate Joseph Weydemeyer), which they contrasted with the “dictatorship of the bourgeoisie”, they thus had already a rich cluster of meanings to draw on. There is the idea that dictatorship is rule without regard for law or traditional norms in special situations; that dictatorship is associated with republican forms, and can be extended, even “perpetual”, yet is not an inheritable office; and the idea that dictatorship (unlike tyranny) need not be, as a matter of definition, used for ill. To this I would say that they added the idea that dictatorship could be a system, not just an individual office, and the “dictator” could be a party or a class.

I’m guessing that this last conceptual addition made it possible for political scientists to use the term “dictatorship” to talk about all forms non-democracy – that is, to set up the modern opposition between democracy and dictatorship. In the age of democracy, even divine-right monarchy could be understood as a form of dictatorship, despite the conceptual opposition in classical political thought between these terms. But this came at a cost, insofar as the rich variety of non-democratic political forms became associated with the pre-existing connotations of the term “dictatorship.”

I think this is a bit unfortunate, not only because of the gap this opened between scholarly and popular uses of the term “dictator” (many people think of a “dictator” as the name for one particular kind of non-democratic ruler, not as a generic term for all such rulers) but also because it hides a number of important conceptual distinctions within non-democratic systems. (As you may have noted, I prefer the very general term “non-democracy” to talk about what many scholars call simply “dictatorships”).

In particular, we can distinguish, roughly, between how authoritarian control over society is (that is, how much of social life is patterned and directed by centralized uses of state power), and how much is the authority of a top leader divorced from control by norms, laws, or other elites more generally; and it is the latter dimension that many people tend to focus on when they talk about dictatorship. Implicit in Bloomberg’s comments, for example, is the idea of the dictator as the unaccountable or unbound leader; and having taught a course on dictatorships for many years I can testify that many of my students come in with the same idea. (I talk about this in my book at more length - this is just the capsule version).

These two “dimensions” of non-democracy often go together, but they can also be decoupled. Consider a place like Vietnam today (where I just visited, so it’s on my mind). A one-party state, most of my readers would be unlikely to call it a democracy, despite the fact that its constitution asserts the principle of democracy, Vietnamese media has been significantly liberalized since the early 2000s, and there’s even some competition in elections to the legislature and within the VCP – certainly more so than in China, and potentially with implications for economic and other outcomes. After all, this is still a country that tightly restricts competition for state power and where independent political organization is not allowed; it is authoritarian in the sense that a great number of activities – especially those connected with the competition for state power – are tightly restricted by the state.

Yet it would be difficult to name a single leader as the “dictator” of Vietnam; specialists in the politics of Vietnam talk instead about a “troika” (the General Secretary of the Communist Party, the President, and the Prime Minister) of mutually accountable and similarly powerful figures, all of whom are ultimately answerable to the Central Committee of the party, which has not been a rubber-stamp body since probably the death of Le Duan. While one could bite the bullet and say that Nguyen Phu Trong, the current General Secretary of the VCP, is Vietnam’s dictator, since Vietnam is a “dictatorship” (= “a non-democratic regime”) and he is by common consent the most powerful figure in the regime, this would sound a bit weird. Better, in my view, to say that Vietnam has an authoritarian regime where the leadership is more or less constrained by formal and informal rules, and so there’s no single “dictator”.

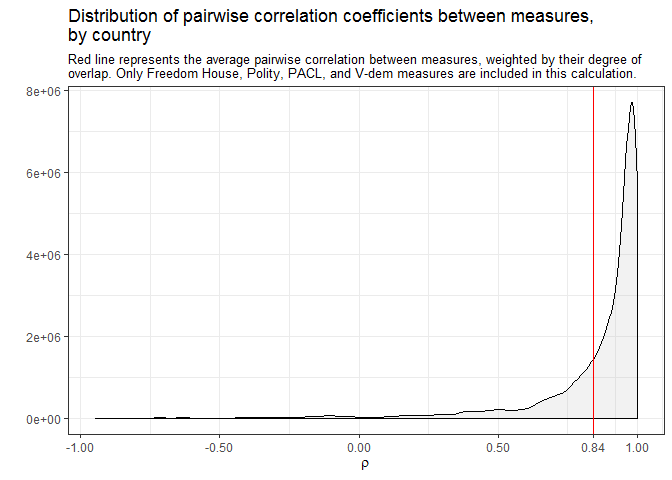
In this framework, what you get is a two-dimensional space where non-democratic regimes vary along the two dimensions of social control or “authoritarianism” and elite accountability or “personalism” (or “dictatorship”). In theory, you could have regimes where social control is fairly extreme (on the “totalitarian” side of the spectrum) but top leaders are tightly constrained by norms of collective leadership, for example, and vice-versa. We can even use data to get a rough picture of these regimes. Using a measure of “personalism” in non-democratic regimes from the latest book by Geddes, Wright, and Frantz (How Dictatorships Work, about which more in a later post perhaps) and a measure of civil society control from the Varieties of Democracy dataset we can get this picture (this is interactive, hover over a dot to see the name of the leader):


Now, this is a purely illustrative picture. I don’t have space to delve into the construction or quality of this data, and I certainly don’t believe all of it. Moreover, the “personalism” data only goes to 2010, so it does not allow us to see what Xi Jinping would look like here. The numbers do not have a real scale either - they represent an arbitrary index. But it does show that there is a lot of variation along these dimensions. Consider China:

According to this measure, the peak of “dictatorship” in China (Mao in the 1960s) is during the Cultural Revolution, which is also the peak of social control. But Mao did not always have this degree of power; earlier he was more of a first among equals, and as the cultural revolution dragged on he also lost prestige, though social control remained high throughout his tenure. In the 1990s, Deng and Hu represent lower levels of personal power – collective leadership eventually became more established at this time – as well as an opening of social control.

The graph's four quadrants represent four distinctive patterns. The “dictators” – leaders with high personal power, unbound by norms, institutions, or the elite – are at the top of the graph. These are the people we might expect: Trujillo, Mobutu, Qaddafi, Franco, the Duvaliers, the Kims, etc. Their regimes take their name from them; they are “dictatorships” in the sense that they can be identified with their dictator. But in some cases (e.g., Compaoré in Burkina Fasso, Kérékou in Benin, Eyadéma in Togo) they did not manage to get the state to exercise much social control (at least by this measure! results may vary on other measures!). Or consider Venezuela, which Geddes, Wright, and Frantz code as a non-democracy from 2006:


Here Chávez appears as a ruler with high personal power, more so than the military dictator Pérez Jiménez, who was constrained by a military Junta. But control over civil society was not extraordinarily high during his tenure, unlike during the military regime (note Pérez Jiménez was overthrown in 1958 - hence that “low social control” point in 1958, since V-Dem data is coded at the end of the year).

At the bottom of the graph, by contrast, we have non-democratic regimes that are not defined by their occupants, because their rulers are much more tightly constrained by norms, institutions, or other elites. In the lower-right corner, in particular, we have regimes that are sometimes confused with democracies. These are places like Taiwan in the early 1990s, or Mexico in the 1980s and 90s (where the President was term limited and constrained by the PRI, other parties existed and were able to organize and compete in elections). Some of these regimes engaged in targeted repression, but it would be a bit weird to say that Zedillo, for example, was the “dictator” of Mexico – though Mexico at the time was authoritarian (even if only in the mild “competitive authoritarian” sense coined by Levitsky and Way).


There is an interesting question here about how leaders come to have personal power – i.e., how they become full-fledged “dictators” in the popular sense of the term. This is a question that Geddes, Wright, and Frantz explore in their book in some detail, and about which I hope to say more later. For now, however, note only that a leader who is unbound by legal or traditional constraints either has what Weber called “charismatic” authority (e.g., Mao in the mid-1960s), or the kind of control over resources that allows them to bypass such legal and normative constraints (e.g., Mobutu in his later years). But that's a story for another post.

Friday, January 19, 2018

Democracy Data, Updated

(Of interest mostly to political scientists or other users of country-year democracy data)

Quick announcement: I’ve just updated my democracyData and QuickUDS R packages (described in this post at more length) to incorporate the latest data from Freedom House (Freedom in the World 2018) and most recent update of the voice and accountability index from the Worldwide Governance Indicators. The democracyData package (https://xmarquez.github.io/democracyData/) allows you to download, tidy, and use a wide variety of datasets with regime and democracy indicators, while the QuickUDS package (https://xmarquez.github.io/QuickUDS/facilitates the construction of Unified Democracy Scores-style latent variable indexes of democracy.

Here’s what Freedom House’s latest data (use with care!) says about the average level of freedom in the world (all countries equally weighted):


Or aggregated by status (free, partly free, not free):


Not so much evidence of a democratic recession, but some evidence of stagnation.

And here in some selected countries:


For contrast, here’s what my version of the Unified Democracy Scores (which incorporate the Freedom House scores as one of their inputs) says about the average level of democracy in the world:


This measure shows a bit more evidence of a decline in the average level of democracy in the world over the past few years, at least according to the indices commonly used by political scientists. This may be simply because only REIGN and Freedom House have data for 2017 so far, so best not to take that dip for 2017 too seriously.

And again the extended UDS for selected countries:


Finally, here’s what the Varieties of Democracy dataset, which I consider to have the best and most flexible set of measures, says:


Here there is only a hint of a downturn in the average level of democracy in the world (but note V-Dem has not yet been updated with 2017 data).

And here is what this data looks like for selected countries:


Enjoy!

Saturday, December 16, 2017

Manchu Status Taxes

The Manchus had their own aristocracy of a kind, formed from the descendants of Nurhaci and other famous warriors, and from the powerful Chinese generals who had submitted early to the rising Qing state. But the Manchus’ ingenious policy held that, within a system of nine aristocratic ranks, a given family dropped one rung on the ladder with each noble incumbent’s death: thus, a title of the third rank would be inherited as a fourth-rank title and then drop to the fifth. Ultimately – unless the emperor repromoted a member for conspicuous merit – the once-noble family would would re-enter the ranks of the commoners. (Jonathan Spence, The Search for Modern China, p. 45).
This is clever: automatic family status depreciation acts as an incentive for the younger generation to prove itself in the eyes of the emperor. Spence does not say much how this system actually worked (or even whether it worked at all – was there a lot of status churn or mobility? did some families retain their status generation after generation?) but it’s still an interesting twist on the idea of aristocracy. Are there any other aristocratic societies where this sort of tax on status inheritance has existed?

Monday, October 02, 2017

The quantification of power: some thoughts on, and tools for, measuring democracy

(More substantive content soon! This is mostly of interest to political scientists, R users, and people concerned with the measurement of democracy).

Democracy is the government of numbers. No other form of government has historically been as concerned with the quantification of power. Indeed, the idea that power depends on the exact numerical strength of one’s supporters, rather than their qualities, would have seemed absurd for most of human history. And I would guess no other form of government has evoked so much mathematical effort. (Even the recent election here in NZ produced extraordinarily sophisticated Bayesian models to predict the outcome).

And yet because the concept of democracy uneasily mingles what is, what can be, and what ought to be, people often object to the attempt to quantify its degree (or even its existence) in particular places and times. (My students often do!). Democracy does not seem like the kind of thing that would be easily and uncontroversially measurable. On the contrary, because any attempt to measure democracy reflects certain normative standards, it cannot but be controversial, especially since most of its conceptualizations for such purposes tend to reduce it to competitive elections with a wide suffrage, which for a variety of reasons seems like an unacceptably narrow view of the ideal to many people.

This is most obvious when we’re talking about cases like Venezuela, where to take a position on the question – to say “Venezuela is a democracy” or “Venezuela is not a democracy” – is to take sides in a rancorous political dispute. But even to say something relatively uncontroversial, like “the United States is a consolidated democracy”, is fraught with normative implications, since clearly “actually existing democracies” (representative governments with non-Potemkin opposition parties and nearly universal suffrage) are highly imperfect, and to give them top scores in some scale seems to imply that they are better than they truly are. In any case, although most people around the world accept democracy as the only legitimate form of government, they disagree enormously about whether or not a given place is or is not actually democratic, and the degree to which particular practices and institutions “matter” for democracy.

Democracy measurement, then, is a somewhat dubious enterprise. The essential contestability of the concept (is democracy about equality, or about self-government, or about freedom? In what proportions?), as well as good-faith differences of opinion about the sorts of preconditions that are essential for its functioning and the kinds of institutions that actualize its values, make it difficult to take seriously any single measurement of “democraticness.” And these disagreements are not really resolvable by appeal to the dictionary; they go back to the earliest discussions of democracy as a distinct phenomenon in history.[1]

Yet I still think the attempt to summarize in some disciplined way particular judgments about “democraticness” over time and in space is useful. A democracy measure seems to me to be a numerical crystalization of a political history: a history at a (literal) glance that can be put to use to say more interesting things about the world. One need not agree with any particular conceptualization of democracy, or take any given measure as a normative standard of what democracy should be, to appreciate the possibility of historical comparison across time and space. And because the concept of democracy is inescapably contested, I think the more the merrier: let a hundred measures of democracy bloom, let a thousand schools of thought contend!

I am thus pleased to announce three different R packages (or rather, two and one update) for accessing and manipulating all the democracy datasets I know about:
  1. A package to access the Varieties of Democracy (V-Dem) dataset, version 7.1 (the latest update). The V-Dem dataset is the gold standard of democracy measurement today. It provides indexes targeting multiple conceptualizations of democracy, and an extremely wide variety of indicators that you can use to satisfy basically every measurement need that you might have; if you don’t like their particular conceptualizations of democracy, you can basically build your own. Each country is coded by at least five people, all of whom live there, and subject to rigorous aggregation and validation procedures. Plus, it is annually updated, and covers the entire period 1900-2016, so it’s pretty comprehensive. If you do any serious empirical research that requires you to use measures of democracy, you should seriously consider using V-Dem as your first choice of measure. This package allows you to access the entire V-Dem dataset (more than 3,000 variables, including external ones) directly from R, and to extract combinations of columns easily according to particular criteria (e.g., section of the codebook where they appear, label, etc.). Check it out at https://xmarquez.github.io/vdem, and install it using devtools::install_github("xmarquez/vdem").
  2. A package to download or access most other democracy datasets used in scholarly work from R, including Polity IV, Freedom House, Geddes, Wright, and Frantz’s Autocratic Regimes dataset, the World Governance Indicators’ “Voice and Accountability” index, the PACL/ACLP/DD dataset, and many others, including some which are now of merely historical interest. (There are 32 of them in the package). The package automates the process of putting these datasets in standard country-year format, assigning appropriate country codes, and the like, and makes it easy to access some less well-known democracy datasets. (Mostly I created it because I’ve spent hundreds of hours tediously repeating these operations!). Check it out at https://xmarquez.github.io/democracyData, and install it using devtools::install_github("xmarquez/democracyData").
  3. Finally, I’ve also updated my package to replicate and extend the Unified Democracy scores. (I first described this package on this blog). This produces a latent variable index from multiple democracy measures, based on methods discussed by Pemstein, Meserve, and Melton in 2010; the most recent update of the package extendes these scores up to 2016 and incorporates revisions and updates of a variety of datasets, including Polity IV, Freedom House, and V-Dem It also includes improvements to the functions used to calculate UDS-style models. Check it out at https://xmarquez.github.io/QuickUDS, and install it using devtools::install_github("xmarquez/QuickUDS").
Feedback, contributors, and pull requests for any of these packages welcome; I hope to be able to submit at least 2 of these packages to CRAN in the near future, so if you use them and encounter any problems let me know. (The V-Dem package is too large for CRAN and will probably never be there).

In what follows, a short discussion of the characteristics of these measures, probably of most interest to people who already use them.

Some general characteristics of democracy measures

The numerical measurement of democracy is about fifty years old. The earliest comprehensive measures of democracy – the Polity project, Freedom House’s Freedom in the World index (first known as the Gastil index), Kenneth Bollen's and Tatu Vanhanen's measures of democracy – go back to the late 1960s and early 1970s. (Vanhanen, who’s been at this business longer than most, identifies some earlier attempts to measure democracy numerically, some going back to the early 1950s, but these were pretty small and unsystematic). There are now 32 different accesible datasets containing some measure of democracy, most developed in the first decade of this century (at least AFAIK):


Most of these measures tend to be highly but not perfectly correlated, reflecting differences in conceptualization as well as varying judgments about the political situation of specific countries and periods:

Yet the high overall level of correlation among these measures masks substantial variation over time:

There is a lot more agreement among measures of democracy after the 1920s than before, simply because it is harder to make judgments of democracy for the more distant past (how much should class-stratified male suffrage count? etc.), though go back far enough and it’s reasonably easy (since there are no democracies past a certain point). In any case, only 13 of the 32 datasets measuring democracy code countries during the 19th century, and only 8 of these make any effort to be comprehensive (mostly because they follow the Polity IV panel, or modify the polity IV scores in some way).

These correlations among measures also mask substantial variation in space:

In other words, while on average the pairwise correlation between different measures of democracy within individual country histories is quite high (0.7), for a substantial minority of countries correlations can be much lower, or even negative. These numbers are better if we only look at the degree of agreement among measures from large, well-resourced projects, to be sure, but they are still by no means reassuring if we are looking for consensus:


Most democracy measurement projects are actually variants of these large-scale efforts; a large number of them take Polity, PACL/ACLP, or Freedom House as starting points to develop their own measures. If we take their correlations as measures of similarity, we can cluster the indexes hierarchically to show these quasi-genealogical family resemblances:


At the top, we have the “Polity cluster” – measures of democracy that mostly just modify Polity, including the Participation-Enhanced Polity Scores (PEPS), the PITF indicators (based on subcomponents of Polity), and the Polity scores themselves. These are highly related with some calculated indexes, including the Unified Democracy Scores and my extension, Freedom House, and Coppedge, Alvarez, and Maldonado’s “contestation dimension” (from a principal components analysis of a number of democracy measures), that attempt to weigh multiple factors in the construction of a measure of democracy, but mostly end up giving weight to the contestability of power and civil liberties.

In the middle we have a cluster that attempts to weigh participation and contestation more equally (LIED, the V-Dem Additive Polyarchy Index, Vanhanen’s Index of Democratization, etc.) and then a cluster of measures that derive from PACL’s attempts to develop a dichotomous measure of democracy (including Boix, Miller and Rosato’s extension as well as Geddes, Wright, and Frantz’s dataset of Autocratic regimes, as well as several other academic datasets). Then there is another cluster of measures that give more weight to formal inclusion (e.g. Doorenspleet, and Bernhard, Nordstrom, and Reenock, both of which make democracy depend on the existence of universal suffrage), a cluster of V-Dem indexes (which weigh multiple factors to come up with a number, including formal inclusiveness), and finally at the bottom we find measures that simply gauge the degree of participation (Vanhanen’s index of participation and the “inclusion dimension” calculated by Coppedge, Alvarez, and Maldonado).

There is a lot more that one could show here, but this is probably enough for now; hope these tools are useful to others! All code for this post available in this repository.

[1] On the other hand, unlike other controversial numerical measures of social phenomena, like university rankings or GDP per capita, governments and other organizations do not spend much time trying to “game” measures of democracy, because few people other than a small number of political scientists care, and little money is at stake. This is probably a good thing, on balance.

Friday, December 09, 2016

New Book: Non-Democratic Politics

My new book, Non-Democratic Politics: Authoritarianism, Dictatorship, and Democratization has been out for a few weeks (Palgrave, Amazon). For the usual vaguely superstitious reasons, I did not want to make an announcement until I had a copy in my hands, but now I do. Just in time for the holidays!
Non-Democratic Politics Book Cover

I confess that I feel a bit ambivalent about the book’s publication. On the one hand, I’m of course glad the book is finally out in the wild; it’s been a long process, and it’s great to be able to touch and see the physical result of my work, and to know that at least some other people will read it. (Much better scholars of authoritarian politics than me also said some nice things about it in the back cover, which is extremely gratifying). Moreover, if you have followed this blog, you will find that some material in the book elaborates and supports many things I have said here more informally (on cults of personality, propaganda, robust action in the Franco regime, the history of political regimes, the Saudi monarchy, etc.); one reason I wrote the book was to be able to put together in a reasonably coherent way my thoughts on these subjects, and I felt encouraged enough by some of the reaction to my writing here to think that I had something to say. (Without this blog, this book probably would not exist; thank you readers!) And since I teach this material here at Vic, the result should be useful as a textbook. (If you teach classes on non-democratic politics do consider the book for use in your course!).

But I also feel that the book should be seen as “version 0.1” of what I really wanted to do. There was more that I wanted to write, and there are things I already want to add or revise (partly in response to current events, partly in response to learning new things), though I will only be able to do this if Palgrave decides there’s enough demand for a second edition. If I had more contractual leeway (and academic clout) I would put the whole thing in my Github repository and make it into an evolving work, adding or deleting material over time as I learn more, or correcting errors as they are brought to my attention, and releasing new versions every so often. But I don’t have that kind of leeway or clout yet (perhaps in the future – we’ll see); and traditional publication still offers some advantages (including dedicated peer review, from which I benefited a lot. Thank you, anonymous reviewers, whoever you are, for helping me improve this book).

In lieu of putting the entire work online, however, I have created a website where all the charts and data in the book are available, and where I can give free rein to my love of ggplot2 graphs and data art. The site (https://xmarquez.github.io/AuthoritarianismBook/) contains replication code for all the figures and tables in the book, natural-language explanations of the code, and full documentation for all the datasets, and is to boot available for download as a single R package. It also contains some extensions of the figures in the book, including huge vertical graphs of the kind that sometimes appear in this blog but could never fit in a normal book. My hope is that people can use this package (and the associated website) to easily do their own exploratory data analysis on the topic. I have tried to make it as user-friendly as possible for people with little experience using R; and I intend to update it regularly and add new features and corrections. Check it out![1]

The hardcover is unfortunately priced (I don’t recommend you buy it, unless you’re an academic library), and I think even the paperback should be cheaper, but I don’t make those decisions. Nevertheless, if you have enjoyed this blog in the past, and would like to see how many of the aspects of non-democratic politics I have discussed here fit together, or you simply wish to learn more about non-democratic politics, consider buying it!

Normal service on this blog will resume shortly.

  1. There will also be some further narrative material available at a different website, including extended discussions of a few cases, but I’m way behind on producing these narratives.

Thursday, March 24, 2016

Artisanal Democracy Data: A Quick and Easy Way of Extending the Unified Democracy Scores

(Apologies for the lack of posting - I've been finishing some big projects. This is of interest primarily to people who care about quantitative measures of democracy in the 19th century, or for some unknown reason enjoy creating latent variable indexes of democracy. Contains a very small amount of code, and references to more.)

If you have followed the graph-heavy posts in this blog, you may have noticed that I really like the Unified Democracy Scores developed by Daniel Pemstein, Stephen Meserve, and James Melton. The basic idea behind this particular measure of democracy, as they explain in their 2010 article, is as follows. Social scientists have developed a wealth of measures of democracy (some large-scale projects like the Polity dataset or the Freedom in the World index, some small “boutique” efforts by political scientists for a particular research project). Though these measures are typically highly correlated (usually in the 0.8-0.9 range), they still differ significantly for some countries and years. These differences are both conceptual (researchers disagree about the essential characteristics of democracy) and empirical (researchers disagree about whether a given country-year is democratic according to a particular definition).

PMM argue that we can assume that these measures are all getting at a latent trait that is only imperfectly observed and conceptualized by the compilers of all the datasets purporting to measure democracy, and that we can estimate this trait using techniques from item response theory that were originally developed to evaluate the performance of multiple graders in academic settings. They then proceeded to do just that, producing a dataset that not only contains latent variable estimates of democracy for 9850 country-years (200 unique countries), but also estimates of the measurement error associated with these scores (derived from the patterns of disagreement between different democracy measures).

This, to be honest, is one of the main attractions of the UDS for me: I get nervous when I see a measure of democracy that does not have a confidence interval around it, given the empirical and conceptual difficulties involved in producing numerical estimates of a woolly concept like “democracy.” Nevertheless, the UDS had some limitations: for one thing, they only went back to 1946, even though many existing measures of democracy contain information for earlier periods, and PMM never made use of all the publicly available measures of democracy in their construction of the scores, which meant that the standard errors around them were relatively large. (The original UDS used 10 different democracy measures for its construction; the current release uses 12, but I count more than 25).

Moreover, the UDS haven’t been updated since 2014 (and then only to 2012), and PMM seem to have moved on from the project. Pemstein, for example, is now involved with measurement at the V-Dem institute, whose “Varieties of Democracy” dataset promises to be the gold standard for democracy measurement, so I’m guessing the UDS will not receive many more updates, if any. (If you are engaged in serious empirical research on democracy, you should probably be using the V-dem dataset anyway. Seriously, it’s amazing - I may write a post about it later this year). And though in principle one could use PMM's procedure to update these scores, and they even made available an (undocumented) replication package in 2013, I was never able to make their software work properly, and their Bayesian algorithms for estimating the latent trait seemed anyway too computationally intensive for my time and budget.

I think this situation is a pity. For my own purposes – which have to do mostly with the history of political regimes for my current project – I’d like a summary measure of democracy that aggregates both empirical and conceptual uncertainty in a principled way for a very large number of countries, just like I believe the UDS did. But I also would like a measure that goes back as far as possible in time, and is easily updated when new information arises (e.g., there are new releases of Freedom House or Polity). The new V-dem indexes are great on some of these counts (they come with confidence intervals) but not on others (they only cover 2014-1900, they are missing some countries, and the full dataset is a bit unwieldy – too many choices distract me). Other datasets – the trusty Polity dataset, the new and excellent LIED index – do go back to the 19th century, but they provide no estimates of measurement error, and they make specific choices about conceptualization that I do not always agree with.

But why wait for others to create my preferred measure when I can do it myself? So I went ahead and figured out how to first replicate the Unified Democracy scores without using a computationally intensive Bayesian algorithm, and then extended them both forwards to 2015 and backwards to the 19th century (in some cases to the 18th century), using information from 28 different measures of democracy (some of them rather obscure, some just new, like the LIED index or the latest version of the Freedom House data). And I created an R package to let you do the same, should you wish to fiddle with the details of the scores or create your own version of the UDS using different source measures. (Democratizing democracy indexes since 2016!).

The gory details are all in this paper, which explains how to replicate and extend the scores, and contains plenty of diagnostic pictures of the result; but if you only want to see the code to produce the extended UDS scores check out the package vignette here. If you are an R user, you can easily install the package and its documentation by typing (assuming you have devtools installed, and that I’ve done everything correctly on my side):

devtools::install_github(repo = "xmarquez/QuickUDS")

The package includes both my “extended” UD scores (fully documented and covering 24111 country-years going all the way to the 18th century in some cases, for 224 sovereign countries and some non-sovereign territories) and a replication dataset which includes 61 different measures of democracy from 29 different measurement efforts covering a total of 24149 country-years (also fully documented). (Even if you are not interested in the UDS, original or extended, you may be interested in that dataset of democracy scores). For those poor benighted souls who use Stata or (God fobid) some awful thing like SPSS (kidding!), you can access a CSV version of the package datasets and a PDF version of their documentation here.

To be sure, for most research projects you probably don’t need this extended Unified Democracy measure. After all, most useful variables in your typical democracy regression are unmeasured or unavailable before the 1950s for most countries, and if your work only requires going back to the 1900s, you are better off with the new V-dem data, rather than this artisanal version of the UDS. But the extended UDS is nice for some things, I think.

First, quantitative history (what I wanted the extended UDS for). For example, consider the problem of measuring democracy in the USA over the entirety of the last two centuries. Existing democracy measures disagree about when the USA first became fully democratic, primarily because they disagree about how much to weigh formal restrictions on women’s suffrage and the formal and informal disenfranchisement of African Americans in their conceptualization. Some measures give the USA the highest possible score early in the 19th century, others after the civil war, others only after 1920, with the introduction of women’s suffrage, and yet others (e.g. LIED) not until 1965, after the Civil Rights Movement. With the extended UDS these differences do not matter very much: as consensus among the different datasets increases, so does the measured US level of democracy:


In the figure above, I use a transformed version of the extended UDS scores whose midpoint is the “consensus” estimate of the cutoff between democracy and non-democracy among minimalist, dichotomous measures in the latent variable scale. (For details, see my paper; the grey areas represent 95% confidence intervals). This version can be interpreted as a probability scale: “1” means the country-year is almost certainly a democracy, “0” means it is almost certainly not a democracy, and “0.5” that it could be either. (Or we could arbitrarily decide that 0-0.33 means the country is likely an autocracy of whatever kind, 0.33-0.66 that it is likely some kind of hybrid regime, and 0.66-1 that is pretty much a democracy, at least by current scholarly standards).

In any case, the extended UDS shows an increase in the USA’s level of democracy in the 1820s (the “Age of Jackson”), the 1870s (after the civil war), the 1920s after female enfranchisement, and a gradual increase in the 1960s after the Civil Rights movement, though the magnitude of each increase (and of the standard error of the resulting score) depends on exactly which measures are used to construct the index. (The spike in the 2000s is an artifact of measurement, having more to do with the fact that lots of datasets end around that time than with any genuine but temporary increase in the USA’s democracy score). Some of these changes would be visible in other datasets, but no other measure would show them all; if you use Polity, for example, you would see a perfect score for the USA since 1871.

Just because what use is this blog if I cannot have a huge vertical visualization, here are ALL THE DEMOCRACY SCORES, alphabetically by country:

(Grey shaded areas represent 95% confidence intervals; blue shaded areas are periods where the country is either deemed to be a member of the system of states in the Gleditsch and Ward list of state system membership since 1816, i.e., independent, or is a microstate in Gleditsch’s tentative list).


A couple of things to note. First, scores are calculated for some countries for periods when they are not generally considered to be independent; this is because some of the underlying data used to produce them (e.g., the V-Dem dataset) produce measures of democracy for existing states when they were under imperial governance (see, e.g., the graphs for India or South Korea).

Second, confidence intervals vary quite a bit, primarily due to the number of measures of democracy available for particular country-years and the degree of their agreement. For some country-years they are so large (because too few datasets bother to produce a measure for a period, or the ones that do disagree radically) that the extended UD score is meaningless, but for most country-years (as I explain in my paper) the standard error of the scores is actually much smaller than the standard error of the “official” UDS, making the measure more useful for empirical research.

Finally, maybe this is just me, but in general the scores tend to capture my intuitions about movements in democracy levels well (which is unsurprising, since they are based on all existing scholarly measures of democracy); see the graphs for Chile or Venezuela, for example. And using these scores we can get a better sense of the magnitude of the historical shifts towards democracy in the last two centuries.

For example, according to the extended UDS (and ignoring measurement uncertainty, just because this is a blog), a good 50% of the world’s population today lives in countries that can be considered basically democratic, but only around 10% live in countries with the highest scores (0.8 and above):

And Huntington’s three waves of democratization are clearly visible in the data (again ignoring measurement uncertainty):


But suppose you are not into quantitative history. There are still a couple of use cases where long-run, quantitative data about democracy with estimates of measurement error is likely to be useful. Consider, for example, the question of the democratic peace, or of the relationship between economic development and democracy – two questions that benefit from very long-run measures of democracy, especially measures that can be easily updated, like this one.

I may write more about this later, but here is an example about a couple of minor things this extended democracy measure might tell us about the basic stylized fact of the “democratic peace.” Using the revised list of interstate wars by Gleditsch, we can create a scatterplot of the mean extended UD score of each side in an interstate war, and calculate the 2-d density distribution of these scores while accounting for their measurement error:

The x- coordinate of each point is the mean extended UD score (in the 0-1 probability scale where 0.5 is the average cutoff between democracy and non-democracy among the most minimalistic measures) of side A in a war listed by Gleditsch; the y-coordinate is the mean extended UD score of side B; each blue square is the 95% “confidence rectangle” around these measures; the shaded blobs are the 2-d probability densities, accounting for measurement error in the scores.

As we can see, the basic stylized fact of a dyadic democratic peace is plausible enough, at least for countries which have a high probability of being democratic. In particular, countries whose mean extended UD democracy score is over 0.8 (in the transformed 0-1 scale) have not fought one another, even after accounting for measurement error. (Though they have fought plenty of wars with other countries, as the plot indicates). But note that the dyadic democratic peace only holds perfectly if we set the cutoff for “being a democracy” quite high (0.8 is in the top 10% of country-years in this large sample; few countries have ever been that democratic); as we go down to the 0.5 cutoff, exceptions accumulate (I’ve labeled some of them).

Anyway, I could go on; if you are interested in this “artisanal” democracy dataset (or in creating your own version of these scores), take a look at the paper, and use the package – and let me know if it works!

(Update 3/25/2016 - some small edits for clarity).

(Update 3/28 - fixed code error).

(Update 3/30 - re-released the code, and updated the graphs, to fix one small mistake with the replication data for the bnr variable).

(Code for this post is available here. Some of it depends on a package I’ve created but not shared yet, so you may not be able to replicate it all.)

Friday, August 28, 2015

The Mismeasure of Growth

About six months ago, Tom Pepinsky wrote a post, on the occasion of Lee Kuan Yew’s death, where he argued graphically that Lee Kuan Yew’s claim to have taken Singapore “from Third World to First” was a bit overstated. (Yes, I’m posting about this six months later - but I have never claimed that this blog offers hot takes on the news!). Using Kristian Gleditsch’s expanded GDP data, he noted that, in percentile terms, Singapore was already quite wealthy by the time it became independent, especially when compared to its neighbours:

By this measure, Singapore was as wealthy as the UK (per capita) by the mid-1970s, not because it had grown especially fast, but because it had started from a relatively high base. On this view, the most we could say is that Singapore escaped the “middle income trap,” not so much the “third world.”

The post got a fair bit of attention, though also, as I recall, a bit of pushback on Twitter and in the comments about both the data source used (Gleditsch rather than the Penn World Table or the Maddison dataset) and the decision to look at the percentile rank of income rather than the actual per capita income. Indeed, the figure above looks different if we use the Penn World Table’s latest measure of “expenditure side real GDP, at chained PPPs” (recommended by the Penn World Table investigators for “comparison of living standards across countries and over time”):

(There’s no data for Myanmar in the PWT 8.1).

Now Singapore’s starting income rank is much closer to Malaysia’s (they were, after all, part of the same country until 1965), solidly in the middle, and does not reach the UK’s income rank until the 1990s, instead of the 1970s. The difference between the two graphs is even starker if, instead of percentile ranks, we simply look at the actual income per capita numbers in PWT8.1 vs the Gleditsch data:

Using the recommended PWT 8.1 measure, Singapore at independence in 1965 had a per capita income of around $3,000 per capita, only a bit higher than Malaysia’s, and only one-sixth of US income; using the Gleditsch data, by contrast, Singapore starts out at nearly double the income level of Malaysia (more than $6000 compared with around $3,500), about a third of US income (and about half of UK income). It’s a big head-start, and it does make Lee’s achievement look a bit less impressive (an average growth rate for the period 1965-1990, when Lee was Prime Minister, of 4.8% rather than 6.9% per year for the PWT8.1 measure). At the time, I thought that the difference between the two estimates of Singaporean GDP was simply a matter of different data sources. But when you dig deeper, it turns out that the source of Gleditsch’s numbers for Singapore was … the Penn World Table (version 8.0)!

What is going on here? In this particular case, the discrepancy is due, first, to adjustments in the 2005 PPPs used between versions 8.0 and 8.1 of the PWT that increased the base price level in many countries and years, and hence lowered their measured GDP, and second, to the fact that the Gleditsch data reports, not the “expenditure side” measure of GDP (basically real GDP adjusted for changes in the terms of trade), but the measure for “output side real GDP at chained PPPs” (which is not adjusted for terms of trade). The latter measure, according to the PWT’s handy guide, is the one that should be used “to compare relative productive capacity across countries and over time,” rather than living standards (which may be affected by favourable terms of trade - e.g., unusually low import prices or unusually high export prices).1 The combined effect of these two differences makes Singapore’s economic performance look less impressive on the Gleditsch measure (PWT 8.0) than on the PWT8.1’s “expenditure side” measure (or even the PWT8.1’s “output side” measure):

Indeed, the estimated growth rates for the period of Lee’s premiership of independent Singapore (1965-1990),2 according to all the different datasets available (Penn World Table 8.0, Penn World Table 8.1, World Development Indicators, Gleditsch, Maddison) do vary a fair amount:

(I include a measure from PWT8.1 for “real consumption of households and government, current PPPs,” which is also used to compare growth in living standards, according to this PWT document. Error bars can be understood as a measure of volatility in the GDP measure - larger bars indicate more ups and downs in the series). To be sure, by whatever measure, Singapore under Lee Kuan Yew grew very fast compared to the rest of the world (certainly in the top 10% of all countries for the period 1965-1990, sometimes appearing as the top performer overall), though it was not among the ranks of the ultra-poor when it started (the low-end estimate of around $3,000 per capita in 1965 may not be rich, but it’s three times the estimated per capita GDP of China in 1965 for the same measure). But purely by accident, the Gleditsch data shows Lee in the worst possible light:

Measure Growth rate Percentile Rank
PWT 8.1: Output side, chained PPPs 7.25% 100 1 out of 57
PWT 8.1: Output side, current PPPs, 2005$ 7.21% 100 1 out of 57
PWT 8.1: Expenditure side, current PPPs, 2005$ 7.03% 100 1 out of 57
PWT 8.1: Expenditure side, chained PPPs 6.89% 100 1 out of 57
WDI: GDP per capita, constant 2005$ 6.63% 100 1 out of 42
Maddison 2013: Real GDP per capita, 1990$ 6.38% 99 2 out of 80
PWT 8.0: Expenditure side, current PPPs, 2005$ 7.01% 98 2 out of 57
PWT 8.0: Expenditure side, chained PPPs 6.88% 98 2 out of 57
PWT 8.0: Output side, current PPPs, 2005$ 6.86% 98 2 out of 57
PWT 8.1: National-accounts growth rates, 2005$ 6.65% 98 2 out of 57
PWT 8.0: National-accounts growth rates, 2005$ 6.65% 98 2 out of 57
PWT 8.1: Real consumption of households and government, current PPPs, 2005$ 5.00% 93 5 out of 57
PWT 8.0: Output side, chained PPPs 4.83% 91 6 out of 57
Gleditsch 4.83% 91 8 out of 83

There are perfectly good reasons for this variation in growth estimates. Current PPP measures of GDP per capita should not, in general, be identical to chained PPP measures, since the PPP conversion factors will vary over time in the latter and not in the former; I assume that this divergence may be magnified when an economy is undergoing genuine structural transformation. Expenditure-side and output-side measures will also vary depending on whether a country is facing better or worse terms of trade, something that will apply especially to trade-dependent economies like Singapore’s.

More generally, the Maddison project, the World Bank, and the Penn World Table project make different adjustments to the numbers produced by national statistical offices, based on different views about how to compare various prices across countries and time and different assumptions about the structure of particular economies. And though in the Singaporean case this is not really a problem, ultimately most estimates of the productive capacity of an economy, or the living standards of a country, depend on the reliability of national statistical agencies, which are subject to different constraints, including lack of resources to gather data and political manipulation. Morten Jerven, for example, argues that in some African countries, the numbers measuring GDP are basically guesstimates of limited value, given the lack of reliable price surveys, the low capacity of some national statistical offices, and the impossibility of measuring certain economic sectors; and Jerome Wallace has written on the political incentives for manipulating GDP statistics in China, especially at the subnational level, which bias Chinese growth rates upwards. (Estimates of Chinese GDP in particular are currently controversial. Though the main PWT data reports estimates of the Chinese economy based on official national accounts data, the PWT researchers also provide an additional table reporting “adjusted” national accounts data based on the research of Harry Wu. The Maddison project reports the Wu-adjusted data instead, which results in generally lower rates of growth before 1990 than the official data).

How much does it matter, however, which measure we use to evaluate the economic performance of particular regimes and political leaders? Which leaders and regimes have the most “disputed” economic performance, depending on the measure used? Using the Beta version of the Archigos dataset, I estimated the growth rates of all available measures of GDP per capita for all political leaders who were in office by at least 8 years up until 2014 in the post-1945 period. Eight years may not seem long, but in fact only about 15% of all leaders survive that long in power, so this is a pretty select group of “political survivors.” Moreover, eight years is two American presidential terms (so the data includes some American leaders), and seems long enough for leaders to actually make a difference, or at least successfully ride out a crisis or two. The economic stars of this select group of about 350 politically over-achieving group of leaders presided over estimated growth rates greater than 90% of all other countries with data for the period in which they were in office (averaging all growth rate estimates from the different datasets):

The variation at the top is enormous, depending on what measure we use. For example, Obasanjo is ranked as the top performing leader from 1999-2007 on many of the PWT8.1 measures, but only in the 84th percentile according to Maddison, and the estimated growth rates for the period range all the way from 6.7% per year (Maddison) to 28% per year (PWT 8.1, growth in consumption). If we believe the PWT, Obasanjo presided over a seven-fold increase in Nigeria’s living standards; if we believe Maddison (or the WDI), Nigerian living standards merely increased by about 1.7 times during his time in office. The economic performance of other leaders varies even more dramatically: if we believe version 8.1 of the PWT, the real consumtion of households and government in Equatorial Guinea under Teodoro Obiang Nguema Mbasogo increased about 6 times from 1979-2014; if we believe the GDP per capita measures on the expenditure side in both versions of the PWT, living standards increased about 45 times; and if we believe the output-side measure from the PWT version 8.0, the productive capacity of the economy of Equatorial Guinea increased about 125 times, more than under any other leader in this dataset. A real benefactor! (Right). In this context, it is reassuring that almost all measures agree that Singapore’s productive capacity and measured living standards increased by around five times during Lee’s time in office.

The same variability is also evident among the very worst performers:

Depending on which measure you use, Nigeria’s economic output and living standards under the military government of Babangida either contracted at a rate of around 17% per year (PWT8.1, expenditure-side measures), or merely remained stagnant (Maddison, World Development indicators). Jabir as-Sabah of Kuwait presided over one of the most severe depressions in modern history (-15% per year for 12 years, output-side measure in PWT 8.0) or merely over an extended recession caused by falling oil prices (-1.3% per year, real consumption measure from PWT 8.1). In the case of Syria under Hafiz al-Assad, the different datasets do not even agree as to whether the economy was growing a bit or shrinking horribly during his time in power.

The problem is not that some datasets always produce higher or lower estimates, but that for some particular kinds of leaders and countries, they seem to disagree for opaque reasons. The biggest divergences in estimates seem to occur for leaders that presided over states whose statistical capacity is at best dubious, or who were undergoing some severe trade shock (wild swings in the price of oil, or severe conflict or civil war), but it’s hard to tell without more detailed analysis. (By contrast, estimates of growth rates in the “advanced” economies of Europe and the USA typically agree across all measures). Here, for example, are the leaders whose growth estimates differ the most (90th percentile and above) when measured in more than two different ways by two or more different datasets, as well as the sources of the high and low estimates:

Leader Lowest Highest Difference Source low Source high Measures
Obasanjo, Nigeria, 1999-2007 6.8% 28.2% 21.43 Maddison 2013: Real GDP per capita, 1990$ PWT 8.1: Real consumption of households and government, current PPPs, 2005$ 15
Babangida, Nigeria, 1985-1993 -18.0% 0.9% 18.84 PWT 8.1: Real consumption of households and government, current PPPs, 2005$ Maddison 2013: Real GDP per capita, 1990$ 14
Emile Lahoud, Lebanon, 1998-2007 0.0% 14.5% 14.45 WDI: GDP per capita, constant 2005$ PWT 8.1: Output side, chained PPPs 15
Jabir As-Sabah, Kuwait, 1978-1990 -14.6% -1.3% 13.28 PWT 8.0: Output side, chained PPPs PWT 8.1: Real consumption of households and government, current PPPs, 2005$ 13
Amad Al Thani, Qatar, 1995-2007 2.8% 15.8% 12.96 Maddison 2013: Real GDP per capita, 1990$ PWT 8.1: Expenditure side, current PPPs, 2005$ 13
Bashar al-Assad, Syria, 2000-2011 1.4% 13.3% 11.87 Maddison 2013: Real GDP per capita, 1990$ PWT 8.1: Real consumption of households and government, current PPPs, 2005$ 13
Bagabandi, Mongolia, 1997-2005 -0.6% 9.9% 10.49 Maddison 2013: Real GDP per capita, 1990$ PWT 8.1: Expenditure side, current PPPs, 2005$ 15
Hun Sen, Cambodia (Kampuchea), 1985-1993 -4.3% 5.4% 9.67 Gleditsch, from Maddison, PWT8.0 PWT 8.0: Output side, current PPPs, 2005$ 13
Nguema Mbasogo, Equatorial Guinea, 1979-2014 5.3% 14.8% 9.52 PWT 8.1: Real consumption of households and government, current PPPs, 2005$ PWT 8.0: Output side, current PPPs, 2005$ 12
Saddam Hussein, Iraq, 1979-2003 -8.6% 0.9% 9.45 Maddison 2013: Real GDP per capita, 1990$ PWT 8.1: Real consumption of households and government, current PPPs, 2005$ 14
H. Aliyev, Azerbaijan, 1993-2003 -5.2% 3.9% 9.04 PWT 8.1: Real consumption of households and government, current PPPs, 2005$ WDI: GDP per capita, PPP, constant 2005$ 15
Hun Sen, Cambodia (Kampuchea), 1997-2014 -0.8% 7.9% 8.64 Gleditsch, from Maddison, PWT8.0 PWT 8.0: Expenditure side, current PPPs, 2005$ 14
Elias Hrawi, Lebanon, 1989-1998 -1.5% 6.8% 8.28 PWT 8.1: Output side, chained PPPs WDI: GDP per capita, constant 2005$ 14
Menem, Argentina, 1988-1999 2.8% 10.9% 8.13 Maddison 2013: Real GDP per capita, 1990$ PWT 8.1: Expenditure side, chained PPPs 14
Khatami, Iran (Persia), 1997-2005 3.5% 11.4% 7.99 WDI: GDP per capita, constant 2005$ PWT 8.1: Expenditure side, current PPPs, 2005$ 15
Akayev, Kyrgyz Republic, 1991-2005 -8.1% -0.2% 7.92 PWT 8.1: Expenditure side, chained PPPs Maddison 2013: Real GDP per capita, 1990$ 15
Yeltsin, Russia (Soviet Union), 1991-1999 -13.2% -5.3% 7.91 PWT 8.1: Output side, current PPPs, 2005$ WDI: GDP per capita, PPP, constant 2005$ 15
Ngouabi, Congo, 1969-1977 -3.6% 4.3% 7.85 PWT 8.0: Output side, chained PPPs PWT 8.1: Output side, current PPPs, 2005$ 14
Al-Assad H., Syria, 1971-2000 -6.0% 1.6% 7.55 Gleditsch, from Maddison, PWT8.0 WDI: GDP per capita, constant 2005$ 14
Jabir As-Sabah, Kuwait, 1991-2006 1.5% 8.8% 7.30 PWT 8.1: Real consumption of households and government, current PPPs, 2005$ PWT 8.0: Output side, current PPPs, 2005$ 13
Nguesso, Congo, 1997-2014 0.3% 7.5% 7.17 PWT 8.0: Output side, chained PPPs PWT 8.1: Output side, chained PPPs 14
Kabbah, Sierra Leone, 1998-2007 -1.2% 6.0% 7.13 PWT 8.0: Output side, chained PPPs Maddison 2013: Real GDP per capita, 1990$ 15
Hu Jintao, China, 2003-2012 2.9% 10.0% 7.09 PWT 8.1: Real consumption of households and government, current PPPs, 2005$ PWT 8.1: National-accounts growth rates, 2005$ 15
Mwinyi, Tanzania/Tanganyika, 1985-1995 -5.6% 1.2% 6.79 PWT 8.1: Real consumption of households and government, current PPPs, 2005$ PWT 8.0: National-accounts growth rates, 2005$ 13
Berdymukhammedov, Turkmenistan, 2006-2014 5.5% 12.2% 6.76 PWT 8.0: Expenditure side, current PPPs, 2005$ PWT 8.1: Real consumption of households and government, current PPPs, 2005$ 14
Ilhma Aliyev, Azerbaijan, 2003-2014 9.6% 16.3% 6.75 WDI: GDP per capita, constant 2005$ PWT 8.1: Output side, chained PPPs 14
Johnson Sirleaf, Liberia, 2006-2014 1.0% 7.6% 6.65 PWT 8.0: Output side, chained PPPs WDI: GDP per capita, PPP, constant 2005$ 14
Manning, Trinidad and Tobago, 2001-2010 5.6% 12.2% 6.55 WDI: GDP per capita, PPP, constant 2005$ PWT 8.1: Output side, chained PPPs 15
Doe, Liberia, 1980-1990 -8.3% -1.9% 6.45 WDI: GDP per capita, constant 2005$ Maddison 2013: Real GDP per capita, 1990$ 14
Hamad Isa Ibn Al-Khalifah, Bahrain, 1999-2014 -1.1% 5.1% 6.27 PWT 8.1: National-accounts growth rates, 2005$ PWT 8.1: Output side, chained PPPs 14
Khalifa Al Nahayan, United Arab Emirates, 2004-2014 -7.1% -0.8% 6.26 WDI: GDP per capita, PPP, constant 2005$ Gleditsch, from Maddison, PWT5.6, Imputed based on first/last available 3
Macias Nguema, Equatorial Guinea, 1968-1979 1.6% 7.6% 5.97 Maddison 2013: Real GDP per capita, 1990$ PWT 8.1: Real consumption of households and government, current PPPs, 2005$ 13

Some of these numbers have an air of fantasy about them. It is not, I think, possible to know with any degree of certainty the GDP per capita of Equatorial Guinea under Macias Nguema (last one in the table above), much less to estimate its growth rate, since government bureaucracies pretty much ceased to operate, the country was more or less off-limits to foreigners, cocoa production collapsed, and perhaps a third of the population fled or was killed during his time in power. (Perhaps “per capita” GDP increased because the population was declining at the time, despite the apparently complete economic disaster, but it’s hard to say: under these circumstances, all GDP numbers must be suspect). Even when the numbers are not utterly fantastic, however, the divergences in growth rates sometimes seem inexplicable without a deep understanding of how the underlying GDP numbers were generated. Should we think that the average growth in living standards under Hu Jintao was around 2.9% per year, or closer to 10% per year? Or was it more like 7%, as the latest expenditure-side measure of GDP per capita from the PWT 8.1 says?

Or take a more detailed look at Nigeria, which has both the worst (Babangida) and the best (Obasanjo) performers in terms of growth, and also the most widely divergent estimates of such growth:3

Datasets do not agree on how high was Nigeria’s GDP at the beginning of Babangida’s time in power, in the mid-1980s: it could have been as high as $1158 per capita (PWT8.0, output side) or as low as $568 (WDI, constant 2005 dollars). By 1994, when he leaves power, it could have been as low as $229 (PWT8.1) or as high as $2,817 (WDI, PPP adjusted), a more than tenfold difference! The datasets also do not agree on how low GDP was by the end of Abacha’s reign and the return to elected governments (was it $1034, according to Maddison? or $228, according to PWT?), or how high GDP was by the end of Obasanjo’s second stint in office (was it $881, in constant 2005 dollars according to the WDI? or as high as $4,527, also according to the World bank, when adjusting for PPP in the particular way the World bank happens to do so here? Or merely around $2,400, according to the expenditure side measure, chained PPPs, of PWT8.1?). Some of these estimates consistently differ by about a factor of five; perhaps country specialists can explain them (adjustments by the statistical office to the national accounts? Different adjustments by dataset providers in response to changing prices of oil?), but the average user seems unlikely to know. Perhaps it’s impossible to tell exactly: based on available data, all we can tell is that average living standards (probably) declined under the military government of Babangida, and (probably) increased under under the elected government of Obasanjo, at least for a hypothetical “average person,” but it’s pointless to try to figure out by how much. (And that’s before we even get into philosophical questions about whether GDP per capita really measures anything of any importance).

The country’s political regime does seem to matter a bit for whether or not a country’s growth estimates agree; in general, estimates for more “democratic” regimes tend to agree more, perhaps because they tend to be calculated under more transparent conditions. Using Geddes, Wright, and Frantz’s dataset of authoritarian regimes, we can calculate the average growth rates and growth percentiles of all regimes in place for at least three years (so there’s enough data to calculate some sensible growth rates) since 1950 (n = 239). (As above, the growth percentiles are relative to the dates of the regime; so, for example, a regime that grew at 5% per year from 1950-1980 may be in the 95th percentile for that period, while a regime that grew at 7% per year in the 1970-1980 period may be only in the 90th percentile for that period, if other countries grew even faster in that time. This is a rough way of adjusting for common factors operating on the world economy on all regimes in a particular period of time; instead of looking at the growth rate of a regime by itself, we can look at how that growth rate compares to the growth rate of all other countries during the regime’s lifetime). Here’s what their growth rates and growth percentiles look like when plotted against their basic regime type (colored dots represent means of growth rates or growth percentiles from one dataset and one measure):

The graph indicates three things. First, for the periods in which there is data, democracies in the sample seem to have grown faster than authoritarian regimes, when averaging over the entire lifetime of each regime, as some of the best research on this topic suggests. Their median “growth percentile” seems to have been higher than that of non-democracies for the periods in which they were in existence. But depending on which measure we use, we could get the opposite result: on the PPP WDI measure, autocracies seem to grow faster than democracies. (A situation ripe for p-hacking!). Second, economic performance in democracies seems to have been more stable than economic performance in non-democracies, as Rodrik and others have shown in more detail elsewhere, though growth rates vary widely across both democracies and non-democracies, and the extent of the variation depends in part on which measure of economic growth we choose to focus on. But third, and most importantly for our purposes here, estimates of economic growth seem to vary more across datasets in non-democracies than in democracies. Especially in countries going through periods of “no authority” (civil wars, warlord regimes, etc.), estimates of growth are basically all over the place, as we should perhaps expect when statistical offices cease to operate and economic activity goes underground.

We can take the same look at the same picture at a finer level of detail:

In some places (e.g., “warlord” regimes - no central authority, like Afghanistan in the early 2000s), the error bars around the mean growth rates are huge, and estimates from different datasets are basically all over the place. Interestingly, estimates of growth percentiles across different datasets also differ quite a bit for the (mostly Middle Eastern) monarchies, and many party or party/military regimes. In comparison, estimates for average growth rates in democracies seem to agree pretty closely across all datasets. Indeed, the standard deviation of the different estimates of the log of the level (not the growth) of GDP, on any given year, within each regime, is higher in non-democracies than in democracies; in other words, estimates of “how wealthy the country is” on any given year differ more within non-democracies than within democracies, and the biggest outliers (the countries where different datasets disagree the most) are all non-democratic:

Moreover, the divergence in estimates is not just due to the poverty of most authoritarian countries; non-democracies have more diverging estimates of GDP at all levels of GDP on any given year. Though poorer democracies and hybrid regimes do tend to have more variable estimates of their level of GDP than richer democracies and hybrid regimes, as we might expect (perhaps poorer countries have more difficulty gathering reliable data), the opposite appears to be true for non-democratic regimes; estimates of the actual level of GDP of richer authoritarian regimes across datasets diverge as much as the estimates of the level of GDP of poorer authoritarian regimes:

Moral of the story: it’s difficult to measure incomes. It’s even harder to construct estimates of income that are comparable across widely different economies and societies, or to interpret these measures appropriately. (Income and political datasets should have more metadata!). But it seems hardest to do that for regimes that can lie with greater impunity.

All code for this post is available here.


  1. The choice to use “output side” (rather than Expenditure side) measures of GDP makes good sense for the Gleditsch data, which is designed for use in international relations research where measuring the productive capacity of an economy is more important than measuring living standards. But Gleditsch’s data for some countries sometimes mixes numbers from Maddison, the World Bank, and PWT that appear to have been calculated in different ways and for different purposes.
  2. The estimated growth rates are the coefficient of the simple linear model log(per capita) ~ year, for each measure of GDP per capita. Technically, these are trend growth rates (the slope of the trend line of the log of per capita GDP), rather than the geometric mean of each year’s growth rate (another usual way of averaging growth rates over time), but the differences remain whichever way one calculates average growth rates, and for most countries the estimated growth rates are pretty similar using either approach (even though trend growth rates may not be appropriate if the time series has a structural break).
  3. See my post on histories of instability for more on these kinds of “deep history” figures.