A rather long post on reading the Korean Central News Agency's headlines I am not putting directly on this blog because it contains interactive graphs that I cannot figure out how to embed, but look nice on GitHub. North Korean politics plus lots of data art, including baroque Sankey flow diagrams!
See it here.
Monday, February 13, 2017
Saturday, January 28, 2017
Big Lies at the Monkey Cage
No, not that post. Just me talking about the uses of lies in politics, which may interest some readers here.
Posts at the Monkey Cage are highly constrained in terms of length and style, so I may as well use this blog for some additional notes and clarifications.
Mythical Lies. One point that perhaps could be stressed with respect to the political uses of myth would be that their acceptance always depends on the persuasiveness of alternative narratives. Moreover, it seems to me that the acceptance of myths usually hinges on taking particular narratives “seriously but not literally,” as was sometimes said of Trump supporters (and could, of course, be said of many other people).
For example, the appeal of the Soviet socialist myth in the 1930s did not hinge on its general accuracy or the degree to which practice lived up to its internal standards, but on its articulation of values that seemed plainly superior to the ones on offer by the major alternative narratives (liberal capitalist or fascist). Not everyone may have felt “dizzy with success” in the 1930s, but little that was credible could be said for capitalism at the time (a lack of credibility reinforced by the impossibility of travel and centralized control of information, of course, but not only by that). Here’s Stephen Kotkin in his magisterial Magnetic Mountain: Stalinism as a Civilization:
Strategic Lies. One thing I did not emphasize in the piece is that people may of course be predisposed to believe lies that accord with their deep-seated identities. Everyone has their own favorite examples of this, though I am reluctant to speak of “belief” in some of the more extreme cases. (See, e.g., this post about the differential predispositions of voters to identify the bigger crowd in two pictures of the inauguration; perhaps it’s better to speak here of people giving the finger to the interviewers, reasserting their partisan identities). But by the same token, these lies do not work for groups whose identities predispose them to reject the message or the messenger (e.g., Democrats, in the question about inauguration pictures).
So “identity-compatible lies” (anyone have a better term?) should be understood as ways to mobilize people, not necessarily (or only) to deceive them, which put them in the same functional category as “loyalty lies” below. From a tactical standpoint, the question then is about the marginal persuasive effect of such lies: does telling a big lie that will be embraced by supporters and rejected by non-supporters increase or reduce the chances that an uncommitted person will believe you?
I’m not sure there’s an obvious answer to this question that is valid for most situations. In any case, it seems to me that, over time, the marginal persuasive effect should decrease, and even become negative (as seems to be happening in Venezuela, where in any case most people who are not Chavistas can and do simply “exit” government propaganda by changing the channel or turning off the TV, and the remaining Chavistas become increasingly subject to cognitive dissonance (how come after all the “successes” proclaimed by the government in the economic war, the other side is still winning?).
Loyalty Lies. The idea that baldfaced lies can help cement the loyalty of the members of a ruling group when trust is scarce seems to be becoming commonplace; both Tyler Cowen and Matthew Yglesias provide good analyses of how this may work within the context of the Trump administration. (Cowen is also interesting on what I would call “lies as vagueness” and their function in maintaining flexibility within coalitions, which I didn’t mention, but which are obviously related to this and this).
But I wanted to plug in specifically a really nice paper by Schedler and Hoffmann (linked, but not mentioned, in my Monkey Cage piece) that stresses the need to “dramatize” unity in authoritarian environments in order to deter challengers during times of crisis. Their key example is the Cuban transition of power from Fidel to Raul Castro (2006-2011) – a situation which saw the need for supposedly “liberal” members of the Cuban regime to show convincingly that they were in fact “on the same page” as everyone else in the elite. And the same need to dramatize unity in a crisis seems to me to be driving the apparent lunacy of some of the statements by Venezuelan officials (check out Hugo Perez Hernaiz’s Venezuelan Conspiracy Theories Monitor for a sampling).
I suspect that the need to dramatize loyalty within a coalition (by “staying on the same page” and thus saying only the latest lie du jour) may conflict with the imperatives of strategic lying (saying things that are credible to the larger groups). Here the tradeoff is about the relative value of support outside vs. support within the ruling group; the less you depend on the former, the less it matters whether elite statements are believed "outside."
Posts at the Monkey Cage are highly constrained in terms of length and style, so I may as well use this blog for some additional notes and clarifications.
Mythical Lies. One point that perhaps could be stressed with respect to the political uses of myth would be that their acceptance always depends on the persuasiveness of alternative narratives. Moreover, it seems to me that the acceptance of myths usually hinges on taking particular narratives “seriously but not literally,” as was sometimes said of Trump supporters (and could, of course, be said of many other people).
For example, the appeal of the Soviet socialist myth in the 1930s did not hinge on its general accuracy or the degree to which practice lived up to its internal standards, but on its articulation of values that seemed plainly superior to the ones on offer by the major alternative narratives (liberal capitalist or fascist). Not everyone may have felt “dizzy with success” in the 1930s, but little that was credible could be said for capitalism at the time (a lack of credibility reinforced by the impossibility of travel and centralized control of information, of course, but not only by that). Here’s Stephen Kotkin in his magisterial Magnetic Mountain: Stalinism as a Civilization:
The antagonism between socialism and capitalism, made that much more pronounced by the Great Depression, was central not only to the definition of what socialism turned out to be, but also to the mind-set of the 1930s that accompanied socialism’s construction and appreciation. This antagonism helps explain why no matter how substantial the differences between rhetoric and practice or intentions and outcome sometimes became, people could still maintain a fundamental faith in the fact of socialism’s existence in the USSR and in that system’s inherent superiority. This remained true, moreover, despite the Soviet regime’s manifest despotism and frequent resort to coercion and intimidation. Simply put, a rejection of Soviet socialism appeared to imply a return to capitalism, with its many deficiencies and all-encompassing crisis— a turn of events that was then unthinkable. (Magnetic Mountain, pp. 153-54).On one reading of Soviet history, the valence of the capitalist and socialist myths eventually reversed (perhaps by the late 1970s? Or later?): capitalism came to seem fundamentally superior to many Soviet citizens, despite its problems (which, incidentally, were constantly pointed out by Soviet propaganda), while Soviet socialism came to appear unworkable and stagnant (despite the material advantages that many Soviet citizens enjoyed, including great employment stability). But this reversal in valence had less to do with specific facts (popular Soviet views of capitalism in the early 90s could be remarkably misinformed) than with an overall loss of trust in the values Soviet myths articulated, reinforced by decades of failed prophecy about the coming abundance. (Perhaps best conceptualized as a cumulative reputational cost of lying?).
Strategic Lies. One thing I did not emphasize in the piece is that people may of course be predisposed to believe lies that accord with their deep-seated identities. Everyone has their own favorite examples of this, though I am reluctant to speak of “belief” in some of the more extreme cases. (See, e.g., this post about the differential predispositions of voters to identify the bigger crowd in two pictures of the inauguration; perhaps it’s better to speak here of people giving the finger to the interviewers, reasserting their partisan identities). But by the same token, these lies do not work for groups whose identities predispose them to reject the message or the messenger (e.g., Democrats, in the question about inauguration pictures).
So “identity-compatible lies” (anyone have a better term?) should be understood as ways to mobilize people, not necessarily (or only) to deceive them, which put them in the same functional category as “loyalty lies” below. From a tactical standpoint, the question then is about the marginal persuasive effect of such lies: does telling a big lie that will be embraced by supporters and rejected by non-supporters increase or reduce the chances that an uncommitted person will believe you?
I’m not sure there’s an obvious answer to this question that is valid for most situations. In any case, it seems to me that, over time, the marginal persuasive effect should decrease, and even become negative (as seems to be happening in Venezuela, where in any case most people who are not Chavistas can and do simply “exit” government propaganda by changing the channel or turning off the TV, and the remaining Chavistas become increasingly subject to cognitive dissonance (how come after all the “successes” proclaimed by the government in the economic war, the other side is still winning?).
Loyalty Lies. The idea that baldfaced lies can help cement the loyalty of the members of a ruling group when trust is scarce seems to be becoming commonplace; both Tyler Cowen and Matthew Yglesias provide good analyses of how this may work within the context of the Trump administration. (Cowen is also interesting on what I would call “lies as vagueness” and their function in maintaining flexibility within coalitions, which I didn’t mention, but which are obviously related to this and this).
But I wanted to plug in specifically a really nice paper by Schedler and Hoffmann (linked, but not mentioned, in my Monkey Cage piece) that stresses the need to “dramatize” unity in authoritarian environments in order to deter challengers during times of crisis. Their key example is the Cuban transition of power from Fidel to Raul Castro (2006-2011) – a situation which saw the need for supposedly “liberal” members of the Cuban regime to show convincingly that they were in fact “on the same page” as everyone else in the elite. And the same need to dramatize unity in a crisis seems to me to be driving the apparent lunacy of some of the statements by Venezuelan officials (check out Hugo Perez Hernaiz’s Venezuelan Conspiracy Theories Monitor for a sampling).
I suspect that the need to dramatize loyalty within a coalition (by “staying on the same page” and thus saying only the latest lie du jour) may conflict with the imperatives of strategic lying (saying things that are credible to the larger groups). Here the tradeoff is about the relative value of support outside vs. support within the ruling group; the less you depend on the former, the less it matters whether elite statements are believed "outside."
Saturday, December 31, 2016
Endnotes
Not much happened on this blog this year, except for two announcements (for my new book and a software package for extending the Unified Democracy Scores); I didn’t even have the usual solstice link post. (Lots of things going on in my offline job; there should be more activity here next year). But there was still a lot of good writing this year worth sharing. In no particular order:
- I’ve continued to really enjoy Ribbonfarm. Some especially interesting or memorable pieces: Adam Elkus' The Strategy of Subversive Conflict; Sarah Perry’s The Origin of Authenticity in the Breakdown of the Illusion of the Real, The Art of the Conspiracy Theory, and Dares, Costly Signals, and Psychopaths; and Venkatesh Rao’s massive 14,000 word piece King Ruinous and the City of Darkness - combining personal memoir, Bihari politics in the age of Lalu Prasad Yadav, the Tata business empire, and many other things in a surprisingly interesting stew.
- Nick Szabo writes occasionally at Unenumerated. His piece on Artifacts of wealth: patterns in the evolution of collectibles and money was very thought-provoking, but just about everything there is worth reading.
- If you’re a political science or IR person, Paul Musgrave has been blogging regularly, mostly but not exclusively interesting book reviews. His twitter account is also very much worth following.
- Nintil is another good blog I discovered this year. I especially enjoyed the Soviet Union series, a good example of the very useful “someone reads the literature so I don’t have to” form of blogging.
- If you’re interested in Chinese politics and economics, Andrew Batson has been really good this year. I especially enjoyed his post What is Socialist about “Socialism with Chinese characteristics”?, but there were many other good ones.
- More China: I’ve really enjoyed following Everyday Life in Mao’s China. Beyond the pictures of “everyday life” during a sometimes difficult period, there’s also a lot of rare art, much of it not obviously political.
- Maciej Ceglowski has some really great talks here. I found the the one on Superintelligence arguments and the one on Lev Sergeyevich Termen, especially interesting. His travel writing is also compulsively readable.
- Inga Clendinnen passed away this year. (Another casualty of 2016). I loved her work on the Aztecs; David Auerbach writes a wonderful essay about her book on the encounter between the Maya and the Spanish, Ambivalent Conquests.
- Zenpundit is hosting a Thucydides Roundatable. I especially liked T. Greer’s Why I read Thucydides and History is Written by the Losers, but there’s lots of good stuff there.
- On Trump and the politics of Trump, some pieces I found useful throughout the year: Timothy Burke’s Trumpism and Expertise; David Auerbach’s Donald Trump: Moosbrugger for President; Adam Aelkus’ Trump: The Explanation of No Explanation; Gabriel Rossman’s Traitors; and Jacob Levy’s Authoritarianism and Post-Truth Politics.
- Venezuela is collapsing, economically and socially. Nick Casey at the New York Times and Hannah Dreier at the Associated Press are doing fantastic reporting; for political argument and analysis, see Caracas Chronicles.
- Among the non-fiction books I read this year, Stephen Kotkin’s Magnetic Mountain: Stalinism as a Civilization, Charles Kurzmann’s The Unthinkable Revolution in Iran, and Robert Crassweller’s Perón and the Enigmas of Argentina have stayed with me. (I may write about Kotkin’s book soon). Also worth mentioning: Achen and Bartels’ Democracy for Realists and Mary Beard’s SPQR.
Friday, December 09, 2016
New Book: Non-Democratic Politics
My new book, Non-Democratic Politics: Authoritarianism, Dictatorship, and Democratization has been out for a few weeks (Palgrave, Amazon). For the usual vaguely superstitious reasons, I did not want to make an announcement until I had a copy in my hands, but now I do. Just in time for the holidays!
I confess that I feel a bit ambivalent about the book’s publication. On the one hand, I’m of course glad the book is finally out in the wild; it’s been a long process, and it’s great to be able to touch and see the physical result of my work, and to know that at least some other people will read it. (Much better scholars of authoritarian politics than me also said some nice things about it in the back cover, which is extremely gratifying). Moreover, if you have followed this blog, you will find that some material in the book elaborates and supports many things I have said here more informally (on cults of personality, propaganda, robust action in the Franco regime, the history of political regimes, the Saudi monarchy, etc.); one reason I wrote the book was to be able to put together in a reasonably coherent way my thoughts on these subjects, and I felt encouraged enough by some of the reaction to my writing here to think that I had something to say. (Without this blog, this book probably would not exist; thank you readers!) And since I teach this material here at Vic, the result should be useful as a textbook. (If you teach classes on non-democratic politics do consider the book for use in your course!).
But I also feel that the book should be seen as “version 0.1” of what I really wanted to do. There was more that I wanted to write, and there are things I already want to add or revise (partly in response to current events, partly in response to learning new things), though I will only be able to do this if Palgrave decides there’s enough demand for a second edition. If I had more contractual leeway (and academic clout) I would put the whole thing in my Github repository and make it into an evolving work, adding or deleting material over time as I learn more, or correcting errors as they are brought to my attention, and releasing new versions every so often. But I don’t have that kind of leeway or clout yet (perhaps in the future – we’ll see); and traditional publication still offers some advantages (including dedicated peer review, from which I benefited a lot. Thank you, anonymous reviewers, whoever you are, for helping me improve this book).
In lieu of putting the entire work online, however, I have created a website where all the charts and data in the book are available, and where I can give free rein to my love of
The hardcover is unfortunately priced (I don’t recommend you buy it, unless you’re an academic library), and I think even the paperback should be cheaper, but I don’t make those decisions. Nevertheless, if you have enjoyed this blog in the past, and would like to see how many of the aspects of non-democratic politics I have discussed here fit together, or you simply wish to learn more about non-democratic politics, consider buying it!
Normal service on this blog will resume shortly.
I confess that I feel a bit ambivalent about the book’s publication. On the one hand, I’m of course glad the book is finally out in the wild; it’s been a long process, and it’s great to be able to touch and see the physical result of my work, and to know that at least some other people will read it. (Much better scholars of authoritarian politics than me also said some nice things about it in the back cover, which is extremely gratifying). Moreover, if you have followed this blog, you will find that some material in the book elaborates and supports many things I have said here more informally (on cults of personality, propaganda, robust action in the Franco regime, the history of political regimes, the Saudi monarchy, etc.); one reason I wrote the book was to be able to put together in a reasonably coherent way my thoughts on these subjects, and I felt encouraged enough by some of the reaction to my writing here to think that I had something to say. (Without this blog, this book probably would not exist; thank you readers!) And since I teach this material here at Vic, the result should be useful as a textbook. (If you teach classes on non-democratic politics do consider the book for use in your course!).
But I also feel that the book should be seen as “version 0.1” of what I really wanted to do. There was more that I wanted to write, and there are things I already want to add or revise (partly in response to current events, partly in response to learning new things), though I will only be able to do this if Palgrave decides there’s enough demand for a second edition. If I had more contractual leeway (and academic clout) I would put the whole thing in my Github repository and make it into an evolving work, adding or deleting material over time as I learn more, or correcting errors as they are brought to my attention, and releasing new versions every so often. But I don’t have that kind of leeway or clout yet (perhaps in the future – we’ll see); and traditional publication still offers some advantages (including dedicated peer review, from which I benefited a lot. Thank you, anonymous reviewers, whoever you are, for helping me improve this book).
In lieu of putting the entire work online, however, I have created a website where all the charts and data in the book are available, and where I can give free rein to my love of
ggplot2 graphs and data art. The site (https://xmarquez.github.io/AuthoritarianismBook/) contains replication code for all the figures and tables in the book, natural-language explanations of the code, and full documentation for all the datasets, and is to boot available for download as a single R package. It also contains some extensions of the figures in the book, including huge vertical graphs of the kind that sometimes appear in this blog but could never fit in a normal book. My hope is that people can use this package (and the associated website) to easily do their own exploratory data analysis on the topic. I have tried to make it as user-friendly as possible for people with little experience using R; and I intend to update it regularly and add new features and corrections. Check it out![1]The hardcover is unfortunately priced (I don’t recommend you buy it, unless you’re an academic library), and I think even the paperback should be cheaper, but I don’t make those decisions. Nevertheless, if you have enjoyed this blog in the past, and would like to see how many of the aspects of non-democratic politics I have discussed here fit together, or you simply wish to learn more about non-democratic politics, consider buying it!
Normal service on this blog will resume shortly.
- There will also be some further narrative material available at a different website, including extended discussions of a few cases, but I’m way behind on producing these narratives. ↩
Thursday, March 24, 2016
Artisanal Democracy Data: A Quick and Easy Way of Extending the Unified Democracy Scores
(Apologies for the lack of posting - I've been finishing some big projects. This is of interest primarily to people who care about quantitative measures of democracy in the 19th century, or for some unknown reason enjoy creating latent variable indexes of democracy. Contains a very small amount of code, and references to more.)
If you have followed the graph-heavy posts in this blog, you may have noticed that I really like the Unified Democracy Scores developed by Daniel Pemstein, Stephen Meserve, and James Melton. The basic idea behind this particular measure of democracy, as they explain in their 2010 article, is as follows. Social scientists have developed a wealth of measures of democracy (some large-scale projects like the Polity dataset or the Freedom in the World index, some small “boutique” efforts by political scientists for a particular research project). Though these measures are typically highly correlated (usually in the 0.8-0.9 range), they still differ significantly for some countries and years. These differences are both conceptual (researchers disagree about the essential characteristics of democracy) and empirical (researchers disagree about whether a given country-year is democratic according to a particular definition).
PMM argue that we can assume that these measures are all getting at a latent trait that is only imperfectly observed and conceptualized by the compilers of all the datasets purporting to measure democracy, and that we can estimate this trait using techniques from item response theory that were originally developed to evaluate the performance of multiple graders in academic settings. They then proceeded to do just that, producing a dataset that not only contains latent variable estimates of democracy for 9850 country-years (200 unique countries), but also estimates of the measurement error associated with these scores (derived from the patterns of disagreement between different democracy measures).
This, to be honest, is one of the main attractions of the UDS for me: I get nervous when I see a measure of democracy that does not have a confidence interval around it, given the empirical and conceptual difficulties involved in producing numerical estimates of a woolly concept like “democracy.” Nevertheless, the UDS had some limitations: for one thing, they only went back to 1946, even though many existing measures of democracy contain information for earlier periods, and PMM never made use of all the publicly available measures of democracy in their construction of the scores, which meant that the standard errors around them were relatively large. (The original UDS used 10 different democracy measures for its construction; the current release uses 12, but I count more than 25).
Moreover, the UDS haven’t been updated since 2014 (and then only to 2012), and PMM seem to have moved on from the project. Pemstein, for example, is now involved with measurement at the V-Dem institute, whose “Varieties of Democracy” dataset promises to be the gold standard for democracy measurement, so I’m guessing the UDS will not receive many more updates, if any. (If you are engaged in serious empirical research on democracy, you should probably be using the V-dem dataset anyway. Seriously, it’s amazing - I may write a post about it later this year). And though in principle one could use PMM's procedure to update these scores, and they even made available an (undocumented) replication package in 2013, I was never able to make their software work properly, and their Bayesian algorithms for estimating the latent trait seemed anyway too computationally intensive for my time and budget.
I think this situation is a pity. For my own purposes – which have to do mostly with the history of political regimes for my current project – I’d like a summary measure of democracy that aggregates both empirical and conceptual uncertainty in a principled way for a very large number of countries, just like I believe the UDS did. But I also would like a measure that goes back as far as possible in time, and is easily updated when new information arises (e.g., there are new releases of Freedom House or Polity). The new V-dem indexes are great on some of these counts (they come with confidence intervals) but not on others (they only cover 2014-1900, they are missing some countries, and the full dataset is a bit unwieldy – too many choices distract me). Other datasets – the trusty Polity dataset, the new and excellent LIED index – do go back to the 19th century, but they provide no estimates of measurement error, and they make specific choices about conceptualization that I do not always agree with.
But why wait for others to create my preferred measure when I can do it myself? So I went ahead and figured out how to first replicate the Unified Democracy scores without using a computationally intensive Bayesian algorithm, and then extended them both forwards to 2015 and backwards to the 19th century (in some cases to the 18th century), using information from 28 different measures of democracy (some of them rather obscure, some just new, like the LIED index or the latest version of the Freedom House data). And I created an R package to let you do the same, should you wish to fiddle with the details of the scores or create your own version of the UDS using different source measures. (Democratizing democracy indexes since 2016!).
The gory details are all in this paper, which explains how to replicate and extend the scores, and contains plenty of diagnostic pictures of the result; but if you only want to see the code to produce the extended UDS scores check out the package vignette here. If you are an R user, you can easily install the package and its documentation by typing (assuming you have devtools installed, and that I’ve done everything correctly on my side):
To be sure, for most research projects you probably don’t need this extended Unified Democracy measure. After all, most useful variables in your typical democracy regression are unmeasured or unavailable before the 1950s for most countries, and if your work only requires going back to the 1900s, you are better off with the new V-dem data, rather than this artisanal version of the UDS. But the extended UDS is nice for some things, I think.
First, quantitative history (what I wanted the extended UDS for). For example, consider the problem of measuring democracy in the USA over the entirety of the last two centuries. Existing democracy measures disagree about when the USA first became fully democratic, primarily because they disagree about how much to weigh formal restrictions on women’s suffrage and the formal and informal disenfranchisement of African Americans in their conceptualization. Some measures give the USA the highest possible score early in the 19th century, others after the civil war, others only after 1920, with the introduction of women’s suffrage, and yet others (e.g. LIED) not until 1965, after the Civil Rights Movement. With the extended UDS these differences do not matter very much: as consensus among the different datasets increases, so does the measured US level of democracy:
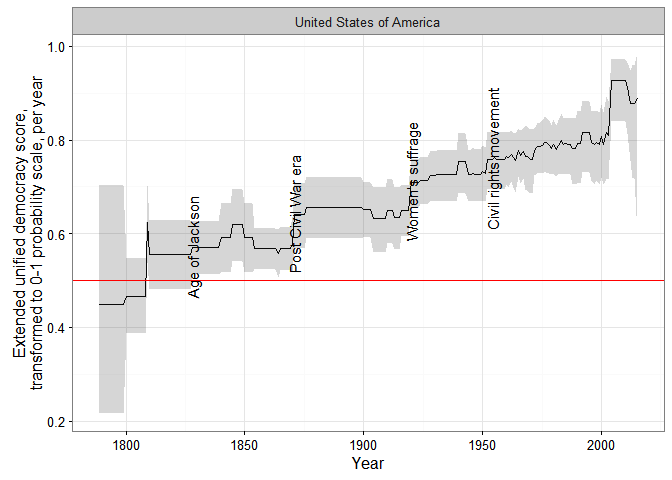
In the figure above, I use a transformed version of the extended UDS scores whose midpoint is the “consensus” estimate of the cutoff between democracy and non-democracy among minimalist, dichotomous measures in the latent variable scale. (For details, see my paper; the grey areas represent 95% confidence intervals). This version can be interpreted as a probability scale: “1” means the country-year is almost certainly a democracy, “0” means it is almost certainly not a democracy, and “0.5” that it could be either. (Or we could arbitrarily decide that 0-0.33 means the country is likely an autocracy of whatever kind, 0.33-0.66 that it is likely some kind of hybrid regime, and 0.66-1 that is pretty much a democracy, at least by current scholarly standards).
In any case, the extended UDS shows an increase in the USA’s level of democracy in the 1820s (the “Age of Jackson”), the 1870s (after the civil war), the 1920s after female enfranchisement, and a gradual increase in the 1960s after the Civil Rights movement, though the magnitude of each increase (and of the standard error of the resulting score) depends on exactly which measures are used to construct the index. (The spike in the 2000s is an artifact of measurement, having more to do with the fact that lots of datasets end around that time than with any genuine but temporary increase in the USA’s democracy score). Some of these changes would be visible in other datasets, but no other measure would show them all; if you use Polity, for example, you would see a perfect score for the USA since 1871.
Just because what use is this blog if I cannot have a huge vertical visualization, here are ALL THE DEMOCRACY SCORES, alphabetically by country:
(Grey shaded areas represent 95% confidence intervals; blue shaded areas are periods where the country is either deemed to be a member of the system of states in the Gleditsch and Ward list of state system membership since 1816, i.e., independent, or is a microstate in Gleditsch’s tentative list).
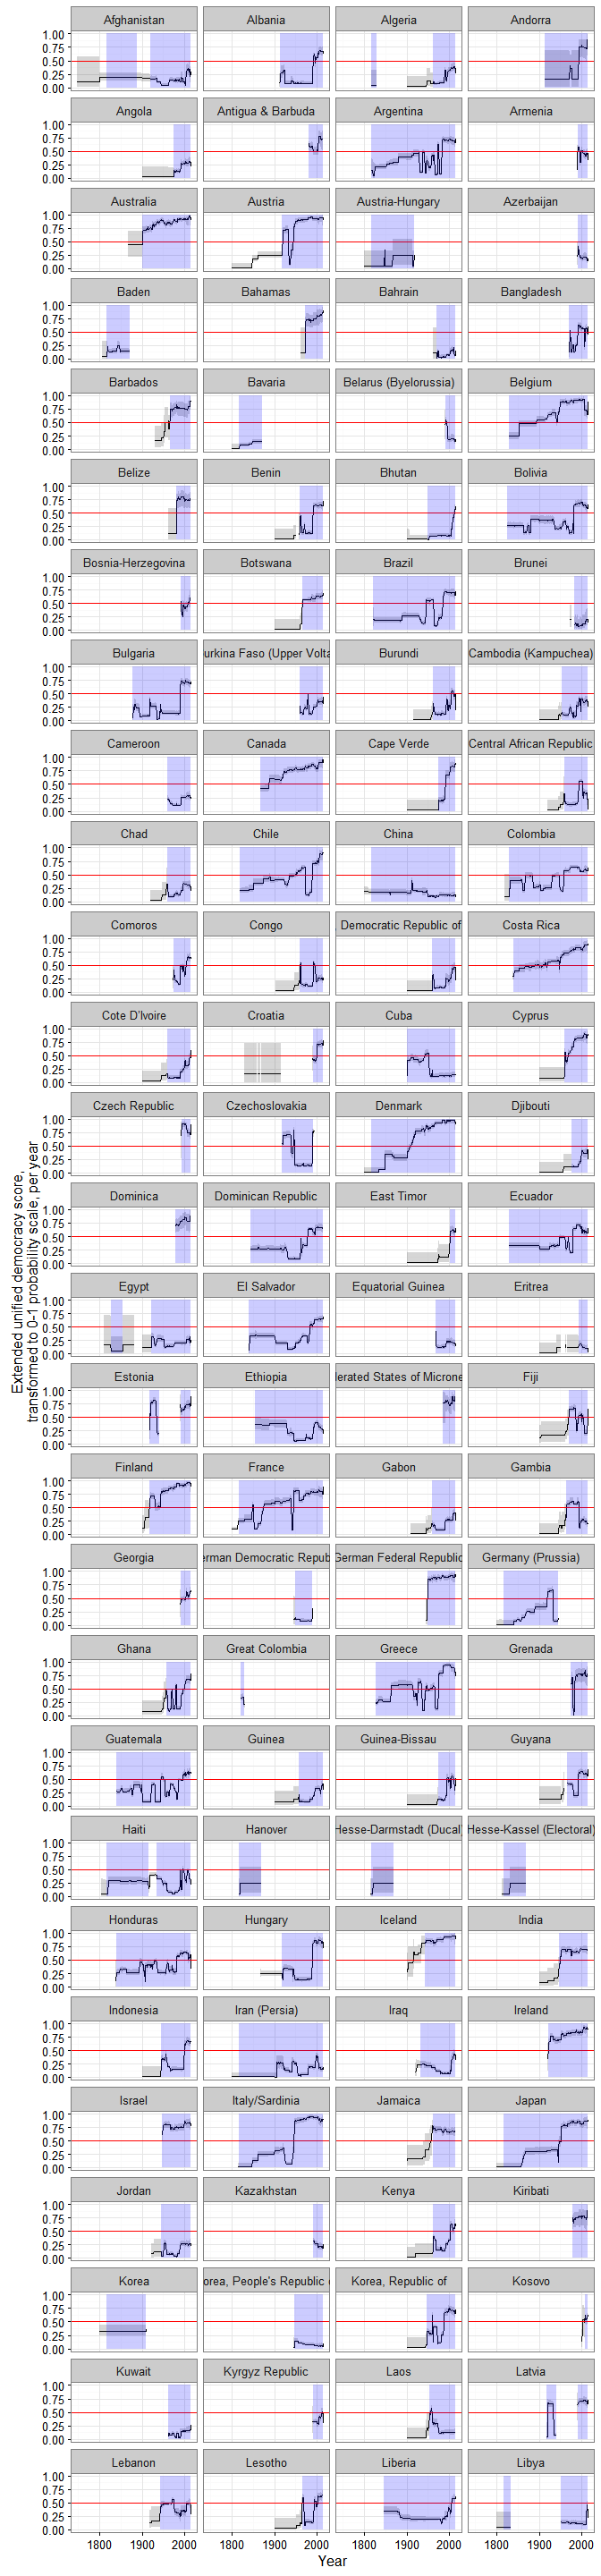
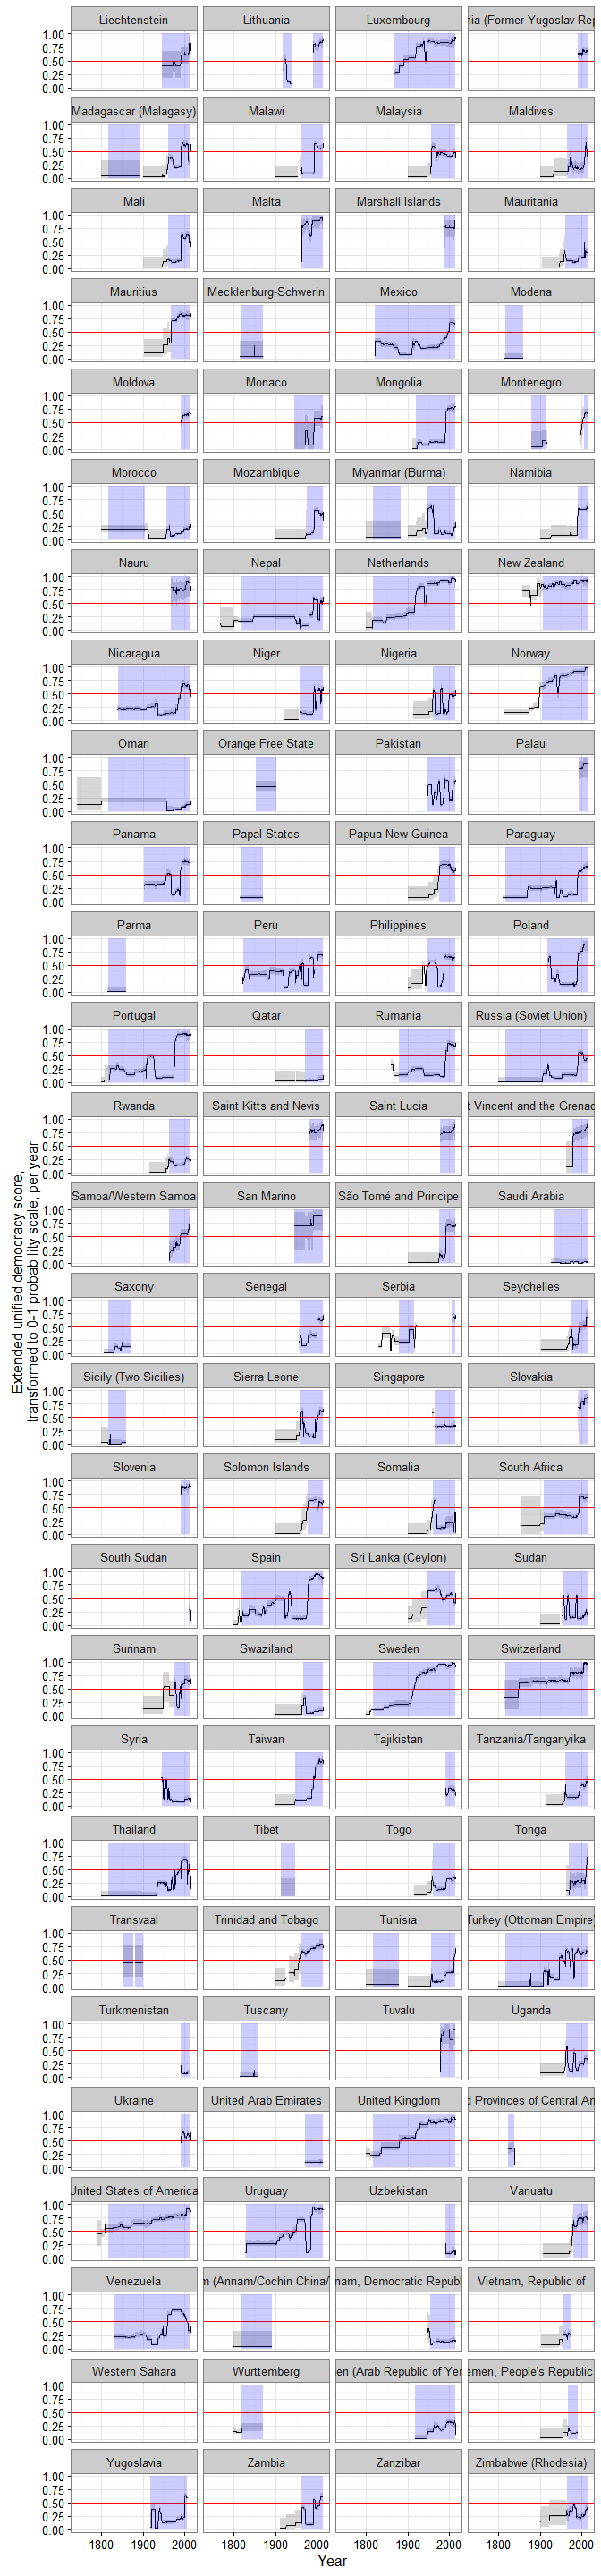
A couple of things to note. First, scores are calculated for some countries for periods when they are not generally considered to be independent; this is because some of the underlying data used to produce them (e.g., the V-Dem dataset) produce measures of democracy for existing states when they were under imperial governance (see, e.g., the graphs for India or South Korea).
Second, confidence intervals vary quite a bit, primarily due to the number of measures of democracy available for particular country-years and the degree of their agreement. For some country-years they are so large (because too few datasets bother to produce a measure for a period, or the ones that do disagree radically) that the extended UD score is meaningless, but for most country-years (as I explain in my paper) the standard error of the scores is actually much smaller than the standard error of the “official” UDS, making the measure more useful for empirical research.
Finally, maybe this is just me, but in general the scores tend to capture my intuitions about movements in democracy levels well (which is unsurprising, since they are based on all existing scholarly measures of democracy); see the graphs for Chile or Venezuela, for example. And using these scores we can get a better sense of the magnitude of the historical shifts towards democracy in the last two centuries.
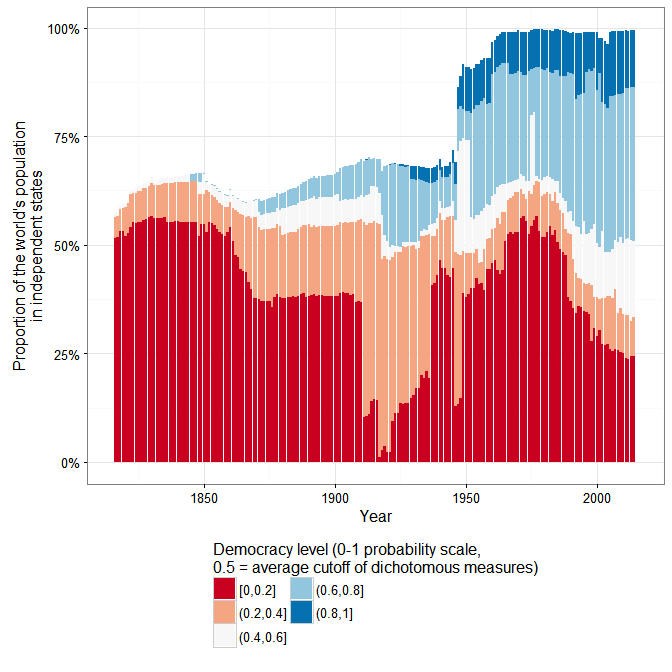
For example, according to the extended UDS (and ignoring measurement uncertainty, just because this is a blog), a good 50% of the world’s population today lives in countries that can be considered basically democratic, but only around 10% live in countries with the highest scores (0.8 and above):
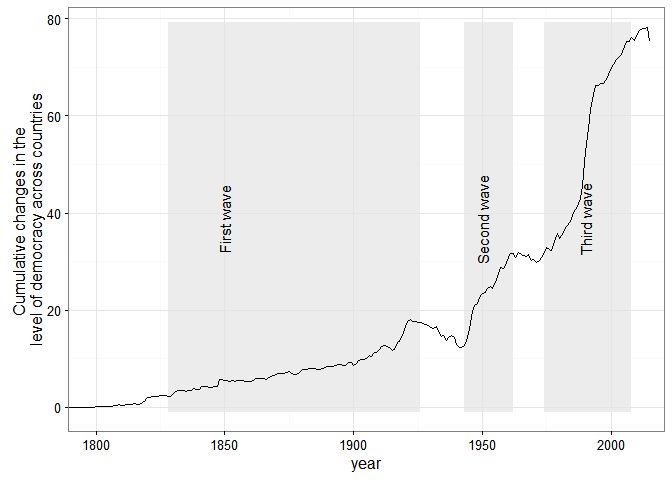
And Huntington’s three waves of democratization are clearly visible in the data (again ignoring measurement uncertainty):
But suppose you are not into quantitative history. There are still a couple of use cases where long-run, quantitative data about democracy with estimates of measurement error is likely to be useful. Consider, for example, the question of the democratic peace, or of the relationship between economic development and democracy – two questions that benefit from very long-run measures of democracy, especially measures that can be easily updated, like this one.
I may write more about this later, but here is an example about a couple of minor things this extended democracy measure might tell us about the basic stylized fact of the “democratic peace.” Using the revised list of interstate wars by Gleditsch, we can create a scatterplot of the mean extended UD score of each side in an interstate war, and calculate the 2-d density distribution of these scores while accounting for their measurement error:
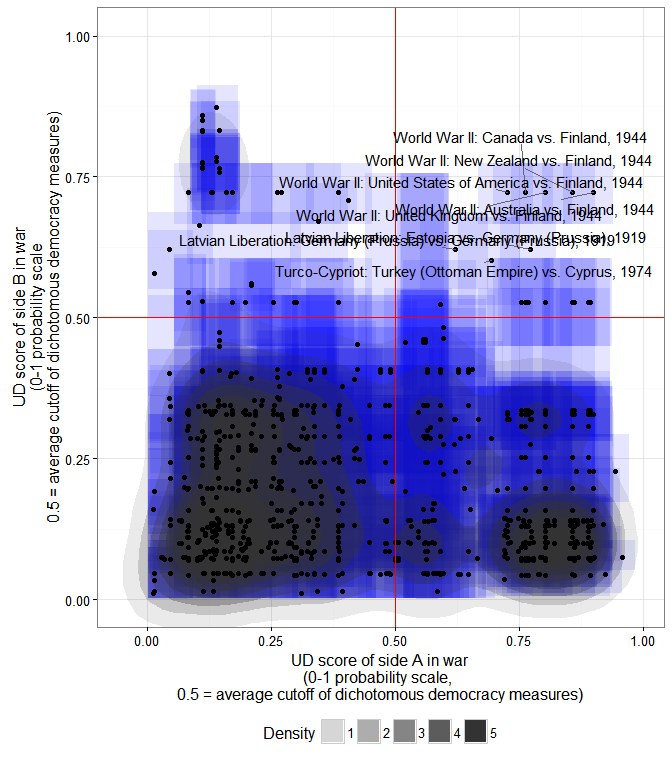
The x- coordinate of each point is the mean extended UD score (in the 0-1 probability scale where 0.5 is the average cutoff between democracy and non-democracy among the most minimalistic measures) of side A in a war listed by Gleditsch; the y-coordinate is the mean extended UD score of side B; each blue square is the 95% “confidence rectangle” around these measures; the shaded blobs are the 2-d probability densities, accounting for measurement error in the scores.
As we can see, the basic stylized fact of a dyadic democratic peace is plausible enough, at least for countries which have a high probability of being democratic. In particular, countries whose mean extended UD democracy score is over 0.8 (in the transformed 0-1 scale) have not fought one another, even after accounting for measurement error. (Though they have fought plenty of wars with other countries, as the plot indicates). But note that the dyadic democratic peace only holds perfectly if we set the cutoff for “being a democracy” quite high (0.8 is in the top 10% of country-years in this large sample; few countries have ever been that democratic); as we go down to the 0.5 cutoff, exceptions accumulate (I’ve labeled some of them).
Anyway, I could go on; if you are interested in this “artisanal” democracy dataset (or in creating your own version of these scores), take a look at the paper, and use the package – and let me know if it works!
(Update 3/25/2016 - some small edits for clarity).
(Update 3/28 - fixed code error).
(Update 3/30 - re-released the code, and updated the graphs, to fix one small mistake with the replication data for the bnr variable).
(Code for this post is available here. Some of it depends on a package I’ve created but not shared yet, so you may not be able to replicate it all.)
If you have followed the graph-heavy posts in this blog, you may have noticed that I really like the Unified Democracy Scores developed by Daniel Pemstein, Stephen Meserve, and James Melton. The basic idea behind this particular measure of democracy, as they explain in their 2010 article, is as follows. Social scientists have developed a wealth of measures of democracy (some large-scale projects like the Polity dataset or the Freedom in the World index, some small “boutique” efforts by political scientists for a particular research project). Though these measures are typically highly correlated (usually in the 0.8-0.9 range), they still differ significantly for some countries and years. These differences are both conceptual (researchers disagree about the essential characteristics of democracy) and empirical (researchers disagree about whether a given country-year is democratic according to a particular definition).
PMM argue that we can assume that these measures are all getting at a latent trait that is only imperfectly observed and conceptualized by the compilers of all the datasets purporting to measure democracy, and that we can estimate this trait using techniques from item response theory that were originally developed to evaluate the performance of multiple graders in academic settings. They then proceeded to do just that, producing a dataset that not only contains latent variable estimates of democracy for 9850 country-years (200 unique countries), but also estimates of the measurement error associated with these scores (derived from the patterns of disagreement between different democracy measures).
This, to be honest, is one of the main attractions of the UDS for me: I get nervous when I see a measure of democracy that does not have a confidence interval around it, given the empirical and conceptual difficulties involved in producing numerical estimates of a woolly concept like “democracy.” Nevertheless, the UDS had some limitations: for one thing, they only went back to 1946, even though many existing measures of democracy contain information for earlier periods, and PMM never made use of all the publicly available measures of democracy in their construction of the scores, which meant that the standard errors around them were relatively large. (The original UDS used 10 different democracy measures for its construction; the current release uses 12, but I count more than 25).
Moreover, the UDS haven’t been updated since 2014 (and then only to 2012), and PMM seem to have moved on from the project. Pemstein, for example, is now involved with measurement at the V-Dem institute, whose “Varieties of Democracy” dataset promises to be the gold standard for democracy measurement, so I’m guessing the UDS will not receive many more updates, if any. (If you are engaged in serious empirical research on democracy, you should probably be using the V-dem dataset anyway. Seriously, it’s amazing - I may write a post about it later this year). And though in principle one could use PMM's procedure to update these scores, and they even made available an (undocumented) replication package in 2013, I was never able to make their software work properly, and their Bayesian algorithms for estimating the latent trait seemed anyway too computationally intensive for my time and budget.
I think this situation is a pity. For my own purposes – which have to do mostly with the history of political regimes for my current project – I’d like a summary measure of democracy that aggregates both empirical and conceptual uncertainty in a principled way for a very large number of countries, just like I believe the UDS did. But I also would like a measure that goes back as far as possible in time, and is easily updated when new information arises (e.g., there are new releases of Freedom House or Polity). The new V-dem indexes are great on some of these counts (they come with confidence intervals) but not on others (they only cover 2014-1900, they are missing some countries, and the full dataset is a bit unwieldy – too many choices distract me). Other datasets – the trusty Polity dataset, the new and excellent LIED index – do go back to the 19th century, but they provide no estimates of measurement error, and they make specific choices about conceptualization that I do not always agree with.
But why wait for others to create my preferred measure when I can do it myself? So I went ahead and figured out how to first replicate the Unified Democracy scores without using a computationally intensive Bayesian algorithm, and then extended them both forwards to 2015 and backwards to the 19th century (in some cases to the 18th century), using information from 28 different measures of democracy (some of them rather obscure, some just new, like the LIED index or the latest version of the Freedom House data). And I created an R package to let you do the same, should you wish to fiddle with the details of the scores or create your own version of the UDS using different source measures. (Democratizing democracy indexes since 2016!).
The gory details are all in this paper, which explains how to replicate and extend the scores, and contains plenty of diagnostic pictures of the result; but if you only want to see the code to produce the extended UDS scores check out the package vignette here. If you are an R user, you can easily install the package and its documentation by typing (assuming you have devtools installed, and that I’ve done everything correctly on my side):
devtools::install_github(repo = "xmarquez/QuickUDS")
To be sure, for most research projects you probably don’t need this extended Unified Democracy measure. After all, most useful variables in your typical democracy regression are unmeasured or unavailable before the 1950s for most countries, and if your work only requires going back to the 1900s, you are better off with the new V-dem data, rather than this artisanal version of the UDS. But the extended UDS is nice for some things, I think.
First, quantitative history (what I wanted the extended UDS for). For example, consider the problem of measuring democracy in the USA over the entirety of the last two centuries. Existing democracy measures disagree about when the USA first became fully democratic, primarily because they disagree about how much to weigh formal restrictions on women’s suffrage and the formal and informal disenfranchisement of African Americans in their conceptualization. Some measures give the USA the highest possible score early in the 19th century, others after the civil war, others only after 1920, with the introduction of women’s suffrage, and yet others (e.g. LIED) not until 1965, after the Civil Rights Movement. With the extended UDS these differences do not matter very much: as consensus among the different datasets increases, so does the measured US level of democracy:
In the figure above, I use a transformed version of the extended UDS scores whose midpoint is the “consensus” estimate of the cutoff between democracy and non-democracy among minimalist, dichotomous measures in the latent variable scale. (For details, see my paper; the grey areas represent 95% confidence intervals). This version can be interpreted as a probability scale: “1” means the country-year is almost certainly a democracy, “0” means it is almost certainly not a democracy, and “0.5” that it could be either. (Or we could arbitrarily decide that 0-0.33 means the country is likely an autocracy of whatever kind, 0.33-0.66 that it is likely some kind of hybrid regime, and 0.66-1 that is pretty much a democracy, at least by current scholarly standards).
In any case, the extended UDS shows an increase in the USA’s level of democracy in the 1820s (the “Age of Jackson”), the 1870s (after the civil war), the 1920s after female enfranchisement, and a gradual increase in the 1960s after the Civil Rights movement, though the magnitude of each increase (and of the standard error of the resulting score) depends on exactly which measures are used to construct the index. (The spike in the 2000s is an artifact of measurement, having more to do with the fact that lots of datasets end around that time than with any genuine but temporary increase in the USA’s democracy score). Some of these changes would be visible in other datasets, but no other measure would show them all; if you use Polity, for example, you would see a perfect score for the USA since 1871.
Just because what use is this blog if I cannot have a huge vertical visualization, here are ALL THE DEMOCRACY SCORES, alphabetically by country:
(Grey shaded areas represent 95% confidence intervals; blue shaded areas are periods where the country is either deemed to be a member of the system of states in the Gleditsch and Ward list of state system membership since 1816, i.e., independent, or is a microstate in Gleditsch’s tentative list).
A couple of things to note. First, scores are calculated for some countries for periods when they are not generally considered to be independent; this is because some of the underlying data used to produce them (e.g., the V-Dem dataset) produce measures of democracy for existing states when they were under imperial governance (see, e.g., the graphs for India or South Korea).
Second, confidence intervals vary quite a bit, primarily due to the number of measures of democracy available for particular country-years and the degree of their agreement. For some country-years they are so large (because too few datasets bother to produce a measure for a period, or the ones that do disagree radically) that the extended UD score is meaningless, but for most country-years (as I explain in my paper) the standard error of the scores is actually much smaller than the standard error of the “official” UDS, making the measure more useful for empirical research.
Finally, maybe this is just me, but in general the scores tend to capture my intuitions about movements in democracy levels well (which is unsurprising, since they are based on all existing scholarly measures of democracy); see the graphs for Chile or Venezuela, for example. And using these scores we can get a better sense of the magnitude of the historical shifts towards democracy in the last two centuries.
For example, according to the extended UDS (and ignoring measurement uncertainty, just because this is a blog), a good 50% of the world’s population today lives in countries that can be considered basically democratic, but only around 10% live in countries with the highest scores (0.8 and above):
And Huntington’s three waves of democratization are clearly visible in the data (again ignoring measurement uncertainty):
But suppose you are not into quantitative history. There are still a couple of use cases where long-run, quantitative data about democracy with estimates of measurement error is likely to be useful. Consider, for example, the question of the democratic peace, or of the relationship between economic development and democracy – two questions that benefit from very long-run measures of democracy, especially measures that can be easily updated, like this one.
I may write more about this later, but here is an example about a couple of minor things this extended democracy measure might tell us about the basic stylized fact of the “democratic peace.” Using the revised list of interstate wars by Gleditsch, we can create a scatterplot of the mean extended UD score of each side in an interstate war, and calculate the 2-d density distribution of these scores while accounting for their measurement error:
The x- coordinate of each point is the mean extended UD score (in the 0-1 probability scale where 0.5 is the average cutoff between democracy and non-democracy among the most minimalistic measures) of side A in a war listed by Gleditsch; the y-coordinate is the mean extended UD score of side B; each blue square is the 95% “confidence rectangle” around these measures; the shaded blobs are the 2-d probability densities, accounting for measurement error in the scores.
As we can see, the basic stylized fact of a dyadic democratic peace is plausible enough, at least for countries which have a high probability of being democratic. In particular, countries whose mean extended UD democracy score is over 0.8 (in the transformed 0-1 scale) have not fought one another, even after accounting for measurement error. (Though they have fought plenty of wars with other countries, as the plot indicates). But note that the dyadic democratic peace only holds perfectly if we set the cutoff for “being a democracy” quite high (0.8 is in the top 10% of country-years in this large sample; few countries have ever been that democratic); as we go down to the 0.5 cutoff, exceptions accumulate (I’ve labeled some of them).
Anyway, I could go on; if you are interested in this “artisanal” democracy dataset (or in creating your own version of these scores), take a look at the paper, and use the package – and let me know if it works!
(Update 3/25/2016 - some small edits for clarity).
(Update 3/28 - fixed code error).
(Update 3/30 - re-released the code, and updated the graphs, to fix one small mistake with the replication data for the bnr variable).
(Code for this post is available here. Some of it depends on a package I’ve created but not shared yet, so you may not be able to replicate it all.)
Subscribe to:
Posts (Atom)